Feed: AWS Big Data Blog.
AWS WAF now includes the ability to log all web requests inspected by the service. AWS WAF can store these logs in an Amazon S3 bucket in the same Region, but most customers deploy AWS WAF across multiple Regions—wherever they also deploy applications. When analyzing web application security, organizations need the ability to gain a holistic view across all their deployed AWS WAF Regions.
This post presents a simple approach to aggregating AWS WAF logs into a central data lake repository, which lets teams better analyze and understand their organization’s security posture. I walk through the steps to aggregate regional AWS WAF logs into a dedicated S3 bucket. I follow that up by demonstrating how you can use Amazon ES to visualize the log data. I also present an option to offload and process historical data using AWS Glue ETL. With the data collected in one place, I finally show you how you can use Amazon Athena and Amazon QuickSight to query historical data and extract business insights.
Architecture overview
The case I highlight in this post is the forensic use of the AWS WAF access logs to identify distributed denial of service (DDoS) attacks by a client IP address. This solution provides your security teams with a view of all incoming requests hitting every AWS WAF in your infrastructure.
I investigate what the IP access patterns look like over time and assess which IP addresses access the site multiple times in a short period of time. This pattern suggests that the IP address could be an attacker. With this solution, you can identify DDoS attackers for a single application, and detect DDoS patterns across your entire global IT infrastructure.

Walkthrough
This solution requires separate tasks for architecture setup, which allows you to begin receiving log files in a centralized repository, and analytics, which processes your log data into useful results.
Prerequisites
To follow along, you must have the following resources:
- Two AWS accounts. Following AWS multi-account best practices, create two accounts:
- A logging account
- A resource account that hosts the web applications using AWS WAFFor more information about multi-account setup, see AWS Landing Zone. Using multiple accounts isolates your logs from your resource environments. This helps maintain the integrity of your log files and provides a central access point for auditing all application, network, and security logs.
- The ability to launch new resources into your account. The resources might not be eligible for Free Tier usage and so might incur costs.
- An application running with an Application Load Balancer, preferably in multiple Regions. If you do not already have one, you can launch any AWS web application reference architecture to test and implement this solution.
For this walkthrough, you can launch an Amazon ECS example from the ecs-refarch-cloudformation GitHub repo. This is a “one click to deploy” example that automatically sets up a web application with an Application Load Balancer. Launch this in two different Regions to simulate a global infrastructure. You ultimately set up a centralized bucket that both Regions log into, which your forensic analysis tools then draw from. Choose Launch Stack to launch the sample application in your Region of choice.
Setup
Architecture setup allows you to begin receiving log files in a centralized repository.
Step 1: Provide permissions
Begin this process by providing appropriate permissions for one account to access resources in another. Your resource account needs cross-account permission to access the bucket in the logging account.
- Create your central logging S3 bucket in the logging account and attach the following bucket policy to it under the Permissions Make a note of the bucket’s ARN. You need this information for future steps.
- Change RESOURCE-ACCOUNT-ID and CENTRAL-LOGGING-BUCKET-ARNto the correct values based on the actual values in your accounts:
Step 2: Manage Lambda permissions
Next, the Lambda function that you create in your resource account needs permissions to access the S3 bucket in your central logging account so it can write files to that location. You already provided basic cross-account access in the previous step, but Lambda still needs the granular permissions at the resources level. Remember to grant these permissions in both Regions where you launched the application that you intend to monitor with AWS WAF.
- Log in to your resource account.
- To create an IAM role for the Lambda function, in the Lambda console, choose Policies, Create Policy.
- Choose JSON, and enter the following policy document. Replace YOUR-SOURCE-BUCKETand YOUR-DESTINATION-BUCKET with the relative ARNs of the buckets that you are using for this walkthrough.
- Choose Review policy, enter your policy name, and save it.
- With the policy created, create a new role for your Lambda function and attach the custom policy to that role. To do this, navigate back to the IAM dashboard.
- Select Create roleand choose Lambda as the service that uses the role. Select the custom policy that you created earlier in this step and choose Next. You can add tags if required and then name and create this new role.
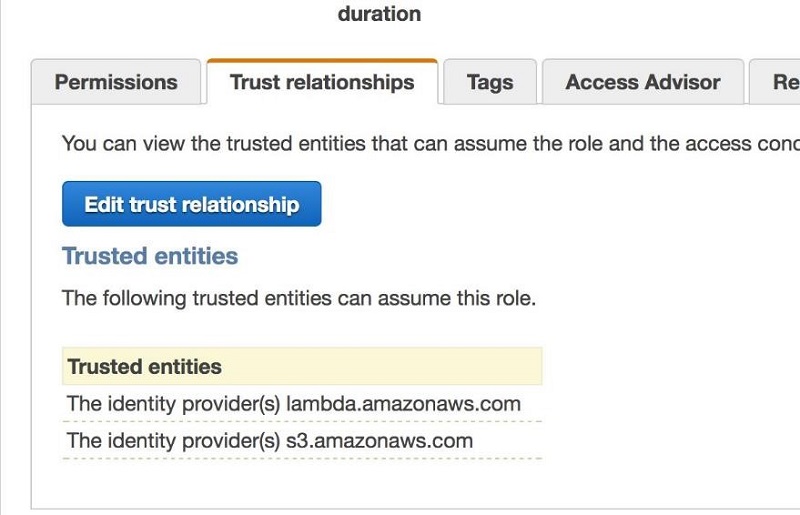
- You must also add S3 as a trusted entity in the Trust Relationship section of the role. Choose Edit trust relationship and add amazonaws.com to the policy, as shown in the following example.
![]()

Lambda and S3 now appear as trusted entities under the Trust relationships tab, as shown in the following screenshot.
Step 3: Create a Lambda function and copy log files
Create a Lambda function in the same Region as your resource account’s S3 bucket. This function reads log files from the resource account bucket and then copies that content to the logging account’s bucket. Repeat this step for every Region where you launched the application that you intend to monitor with AWS WAF.
- Log in to your resource account.
- Navigate to Lambda in your console and choose Create Function.
- Choose the Author from scratch function and name it. Choose the IAM role you created in the previous step and attach it to the Lambda function.
![]()
- Choose Create function.
- This Lambda function receives a document from S3 that contains nested JSON string data. To handle this data, you must extract the JSON from this string to retrieve key names of both the document and the bucket. Your function then uses this information to copy the data to your central logging account bucket in the next step. To create this function, Copy and paste this code into the Lambda function that you created. Replace the bucket names with the names of the buckets that you created earlier. After you decide on a partitioning strategy, modify this script later.

Step 4: Set S3 to Lambda event triggers
This step sets up event triggers in your resource account’s S3 buckets. These triggers send the file name and location logged by AWS WAF logs to the Lambda function. The triggers also notify the Lambda function that it must move the newly arrived file into your central logging bucket. Repeat this step for every Region where you launched the application that you intend to monitor with AWS WAF.
- Go to the S3 dashboard and choose your S3 bucket, then choose the Properties Under Advanced settings, choose Events.
![]()
- Give your event a name and select PUT from the Events check boxes.
- Choose Lambda from the Send To option and select your Lambda function as the destination for the event.
![]()


Step 5: Add AWS WAF to the Application Load Balancer
Add an AWS WAF to the Application Load Balancer so that you can start logging events. You can optionally delete the original log file after Lambda copies it. This reduces costs, but your business and security needs might err on the side of retaining that data.
Create a separate prefix for each Region in your central logging account bucket waf-central-logs so that AWS Glue can properly partition them. For best practices of partitioning with AWS Glue, see Working with partitioned data in AWS Glue. AWS Glue ingests your data and stores it in a columnar format optimized for querying in Amazon Athena. This helps you visualize the data and investigate the potential attacks.
Repeat this step for every Region where you launched the application that you intend to monitor with AWS WAF. The procedure assumes that you already have an AWS WAF enabled that you can use for this exercise. To move forward with the next step, you need AWS WAF enabled and connected to Amazon Kinesis Data Firehose for log delivery.
Setting up and configuring AWS WAF
If you don’t already have a web ACL in place, set up and configure AWS WAF at this point. This solution handles logging data from multiple AWS WAF logs in multiple Regions from more than one account.
To do this efficiently, you should consider your partitioning strategy for the data. You can grant your security teams a comprehensive view of the network. Create each partition based on the Kinesis Data Firehose delivery stream for the specific AWS WAF associated with the Application Load Balancer. This partitioning strategy also allows the security team to view the logs by Region and by account. As a result, your S3 bucket name and prefix look similar to the following example:
s3://central-waf-logs/
Step 6: Copying logs with Lambda code
This step updates the Lambda function to start copying log files. Keep your partitioning strategy in mind as you update the Lambda function. Repeat this step for every Region where you launched the application that you intend to monitor with AWS WAF.
To accommodate the partitioning, modify your Lambda code to match the examples in the GitHub repo.
Replace
Kinesis Data Firehose should now begin writing files to your central S3 logging bucket with the correct partitioning. To generate logs, access your web application.
Analytics
Now that Kinesis Data Firehose can write collected files into your logging account’s S3 bucket, create an Elasticsearch cluster in your logging account in the same Region as the central logging bucket. You also must create a Lambda function to handle S3 events as the central logging bucket receives new log files. This creates a connection between your central log files and your search engine. Amazon ES gives you the ability to query your logs quickly to look for potential security threats. The Lambda function loads the data into your Amazon ES cluster. Amazon ES also includes a tool named Kibana, which helps with managing data and creating visualizations.
Step 7: Create an Elasticsearch cluster
- In your central Logging Account, navigate to the Elasticsearch Service in the AWS Console.
- Select Create Cluster, enter a domain name for your cluster, and choose version 3 from the Elasticsearch version dropdown. Choose Next.
![]() In this example, don’t implement any security policies for your cluster and only use one instance. For any real-world production tasks, keep your Elasticsearch Cluster inside your VPC.
In this example, don’t implement any security policies for your cluster and only use one instance. For any real-world production tasks, keep your Elasticsearch Cluster inside your VPC. - For network configuration, choose Public access and choose Next.
![]()
- For the access policy, and this tutorial, only allow access to the domain from a specified Account ID or ARN address. In this case, use your Account ID to gain access.
- Choose Next and on the final screen and confirm. You generally want to create strict access policies for your domain and not allow public access. This example only uses these settings to quickly demonstrate the capabilities of AWS services. I would never recommend this in a production environment.
 In this example, don’t implement any security policies for your cluster and only use one instance. For any real-world production tasks, keep your
AWS takes a few minutes to finish and activate your Amazon ES. Once it goes live, you can see two endpoints. The Endpoint URL is the URL you use to send data to the cluster.
Step 8: Create a Lambda function to copy log files
Add an event trigger to your central logs bucket. This trigger tells your Lambda function to write the data from the log file to Amazon ES. Before you create the S3 trigger, create a Lambda function in your logging account to handle the events.
For this Lambda function, we use code from the aws-samples GitHub repository that streams data from an S3 file line by line into Amazon ES. This example uses code taken from amazon-elasticsearch-lambda-samples. Name your new Lambda function myS3toES.
- Copy and paste the following code into a text file named js:
- Copy and paste this code into a text file and name it json:
- Execute the following command in the folder containing these files:
> npm install - After the installation completes, create a .zip file that includes the js file and the node_modules folder.
- Log in to your logging account.
- Upload your .zip file to the Lambda function. For Code entry type, choose Upload a .zip file.
- This Lambda function needs an appropriate service role with a trust relationship to S3. Choose Edit trust relationships and add amazonaws.com and lambda.amazonaws.com as trusted entities.
- Set up your IAM role with the following permissions: S3 Read Only permissions and Lambda Basic Execution. To grant the role the appropriate access, assign it to the Lambda function from the Lambda Execution Role section in the console.
![]()
- Set Environment variables for your Lambda function so it knows where to send the data. Add an endpoint and use the endpoint URL you created in Step 7. Add an index and enter your index name. Add a value for region and detail the Region where you deployed your application.
![]()


Step 9: Create an S3 trigger
After creating the Lambda function, create the event triggers on your S3 bucket to execute that function. This completes your log delivery pipeline to Amazon ES. This is a common pipeline architecture for streaming data from S3 into Amazon S3.
- Log in to your central logging account.
- Navigate to the S3 console, select your bucket, then open the Properties pane and scroll down to Events.
- Choose Add notification and name your new event s3toLambdaToEs.
- Under Events, select the check box for PUT. Leave Prefix and Suffix
- Under Send to, select Lambda Function, and enter the name of the Lambda function that you created in the previous step—in this example, myS3toES.
- Choose Save.
With this complete, Lambda should start sending data to your Elasticsearch index whenever you access your web application.
Step 10: Configure Amazon ES
Your pipeline now automatically adds data to your Elasticsearch cluster. Next, use Kibana to visualize the AWS WAF logs in the central logging account’s S3 bucket. This is the final step in assembling your forensic investigation architecture.
Kibana provides tools to create visualizations and dashboards that help your security teams view log data. Using the log data, you can filter by IP address to see how many times an IP address has hit your firewall each month. This helps you track usage anomalies and isolate potentially malicious IP addresses. You can use this information to add web ACL rules to your firewall that adds extra protection against those IP addresses.
Kibana produces visualizations like the following screenshot.

In addition to the Number of IPs over Time visualization, you can also correlate the IP address to its country of origin. Correlation provides even more precise filtering for potential web ACL rules to protect against attackers. The visualization for that data looks like the following image.
Elasticsearch setup
To set up and visualize your AWS WAF data, follow this How to analyze AWS WAF logs using Amazon Elasticsearch Service post. With this solution, you can investigate your global dataset instead of isolated Regions.
An alternative to Amazon ES
Amazon ES is an excellent tool for forensic work because it provides high-performance search capability for large datasets. However, Amazon ES requires cluster management and complex capacity planning for future growth. To get top-notch performance from Amazon ES, you must adequately scale it. With the more straightforward data of these investigations, you could instead work with more traditional SQL queries.
Forensic data grows quickly, so using a relational database means you might quickly outgrow your capacity. Instead, take advantage of AWS serverless technologies like AWS Glue, Athena, and Amazon QuickSight. These technologies enable forensic analysis without the operational overhead you would experience with Elasticsearch or a relational database. To learn more about this option, consult posts like How to extract, transform, and load data from analytic processing using AWS Glue and Work with partitioned data in AWS Glue.
Athena query
With your forensic tools now in place, you can use Athena to query your data and analyze the results. This lets you refine the data for your Kibana visualizations, or directly load it into Amazon QuickSight for additional visualization. Use the Athena console to experiment until you have the best query for your visual needs. Having the database in your AWS Glue Catalog means you can make ad hoc queries in Athena to inspect your data.
In the Athena console, create a new Query tab and enter the following query:
Replace
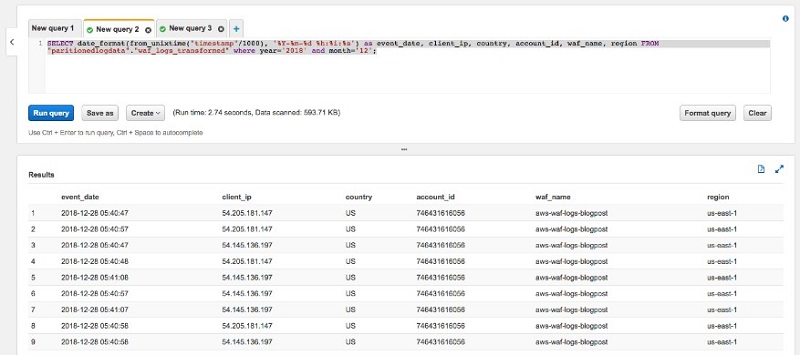
You can see which IP addresses hit your environment the most over any period of time. In a production environment, you would run an ETL job to re-partition this data and transform it into a columnar format optimized for queries. If you would like more information about doing that, see the Best Practices When Using Athena with AWS Glue post.
Amazon QuickSight visualization
Now that you can query your data in Athena, you can visualize the results using Amazon QuickSight. First, grant Amazon QuickSight access to the S3 bucket where your Athena query results live.
- In the Amazon QuickSight console, log in.
- Choose Admin/username, Manage QuickSight.
- Choose Account settings, Security & permissions.
- Under QuickSight access to AWS services, choose Add or remove.
![]()
- Choose Amazon S3, then choose Select S3 buckets.
![]()
- Choose the output bucket for your central AWS WAF logs. Also, choose your Athena query results bucket. The query results bucket begins with aws-athena-query-results-*.


Amazon QuickSight can now access the data sources. To set up your visualizations, follow these steps:
- In the QuickSight console, choose Manage data, New data set.
- For Source, choose Athena.
- Give your new dataset a name and choose Validate connection.
- After you validate the connection, choose Create data source.
![]()
- Select Use custom SQL and give your SQL query a name.
- Input the same query that you used earlier in Athena, and choose Confirm query.
![]()
- Choose Import to SPICE for quicker analytics, Visualize.


Allow Amazon QuickSight several minutes. It alerts you after completing the import.
Now that you have imported your data into your analysis, you can apply a visualization:
- In Amazon QuickSight, New analysis.
![]()
- Select the last dataset that you created earlier and choose Create analysis.
- At the bottom left of the screen, choose Line Chart.
- Drag and drop event_date to the X-Axis
- Drag and drop client_ip to the ValueThis should create a visualization similar to the following image.
![]()
- Choose the right arrow at the top left of the visualization and choose Hide “other” categories.This should modify your visualization to look like the following image.
![]()


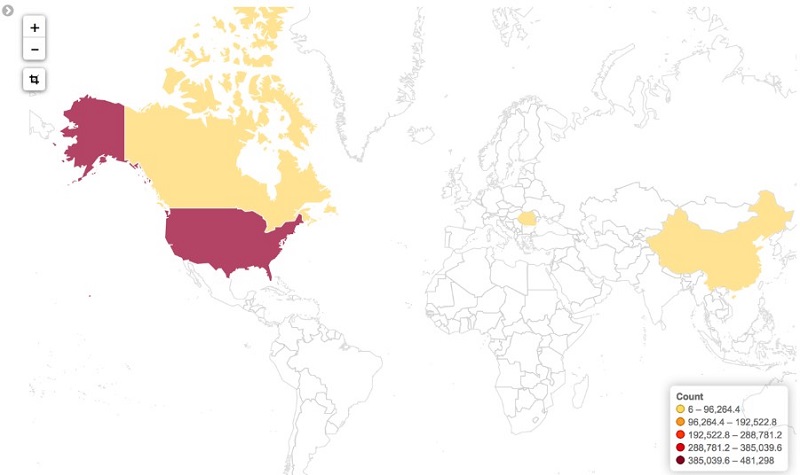
You can also map the countries from which the requests originate, allowing you to track global access anomalies. You can do this in QuickSight by selecting the “Points on map” visualization type and choosing the country as the data point to visualize.

You can also add a count of IP addresses to see if you have any unusual access patterns originating from specific IP addresses.

Conclusion
Although Amazon ES and Amazon QuickSight offer similar final results, there are trade-offs to the technical approaches that I highlighted. If your use case requires the analysis of data in real time, then Amazon ES is more suitable for your needs. If you prefer a serverless approach that doesn’t require capacity planning or cluster management, then the solution with AWS Glue, Athena, and Amazon QuickSight is more suitable.
In this post, I described an easy way to build operational dashboards that track key metrics over time. Doing this with AWS Glue, Athena, and Amazon QuickSight relieves the heavy lifting of managing servers and infrastructure. To monitor metrics in real time instead, the Amazon ES solution provides a way to do this with little operational overhead. The key here is the adaptability of the solution: putting different services together can provide different solutions to your problems to fit your exact needs.
For more information and use cases, see the following resources:
Hopefully, you have found this post informative and the proposed solutions intriguing. As always, AWS welcomes all feedback or comment.
About the Authors
 Aaron Franco is a solutions architect at Amazon Web Services .