Quantcast
Channel: Streams – Cloud Data Architect
Viewing all 965 articles
Browse latest View live

Automated Refactoring from Mainframe to Serverless Functions and Containers with Blu Age

$
0
0

Feed: AWS Partner Network (APN) Blog.
Author: Phil de Valence.

By Alexis Henry, Chief Technology Officer at Blu Age
By Phil de Valence, Principal Solutions Architect for Mainframe Modernization at AWS

Mainframe workloads are often tightly-coupled legacy monoliths with millions of lines of code, and customers want to modernize them for business agility.

Manually rewriting a legacy application for a cloud-native architecture requires re-engineering use cases, functions, data models, test cases, and integrations. For a typical mainframe workload with millions of lines of code, this involves large teams over long periods of time, which can be risky and cost-prohibitive.

Fortunately, Blu Age Velocity accelerates the mainframe transformation to agile serverless functions or containers. It relies on automated refactoring and preserves the investment in business functions while expediting the reliable transition to newer languages, data stores, test practices, and cloud services.

Blu Age is an AWS Partner Network (APN) Select Technology Partner that helps organizations enter the digital era by modernizing legacy systems while substantially reducing modernization costs, shortening project duration, and mitigating the risk of failure.

In this post, we’ll describe how to transform a typical mainframe CICS application to Amazon Web Services (AWS) containers and AWS Lambda functions. We’ll show you how to increase mainframe workload agility with refactoring to serverless and containers.

Customer Drivers

There are two main drivers for mainframe modernization with AWS: cost reduction and agility. Agility has many facets related to the application, underlying infrastructure, and modernization itself.

On the infrastructure agility side, customers want to go away from rigid mainframe environments in order to benefit from the AWS Cloud’s elastic compute, managed containers, managed databases, and serverless functions on a pay-as-you-go model.

They want to leave the complexity of these tightly-coupled systems in order to increase speed and adopt cloud-native architectures, DevOps best practices, automation, continuous integration and continuous deployment (CI/CD), and infrastructure as code.

On the application agility side, customers want to stay competitive by breaking down slow mainframe monoliths into leaner services and microservices, while at the same time unleashing the mainframe data.

Customers also need to facilitate polyglot architectures where development teams decide on the most suitable programming language and stack for each service.

Some customers employ large teams of COBOL developers with functional knowledge that should be preserved. Others suffer from the mainframe retirement skills gap and have to switch to more popular programming languages quickly.

Customers also require agility in the transitions. They want to choose when and how fast they execute the various transformations, and whether they’re done simultaneously or independently.

For example, a transition from COBOL to Java is not only a technical project but also requires transitioning code development personnel to the newer language and tools. It can involve retraining and new hiring.

A transition from mainframe to AWS should go at a speed which reduces complexity and minimizes risks. A transition to containers or serverless functions should be up to each service owner to decide. A transition to microservices needs business domain analysis, and consequently peeling a monolith is done gradually over time.

This post shows how Blu Age automated refactoring accelerates the customer journey to reach a company’s desired agility with cloud-native architectures and microservices. Blu Age does this by going through incremental transitions at a customer’s own pace.

Sample Mainframe COBOL Application

Let’s look at a sample application of a typical mainframe workload that we will then transform onto AWS.

This application is a COBOL application that’s accessed by users via 3270 screens defined by CICS BMS maps. It stores data in a DB2 z/OS relational database and in VSAM indexed files, using CICS Temporary Storage (TS) queues.

Blu-Age-Serverless-1

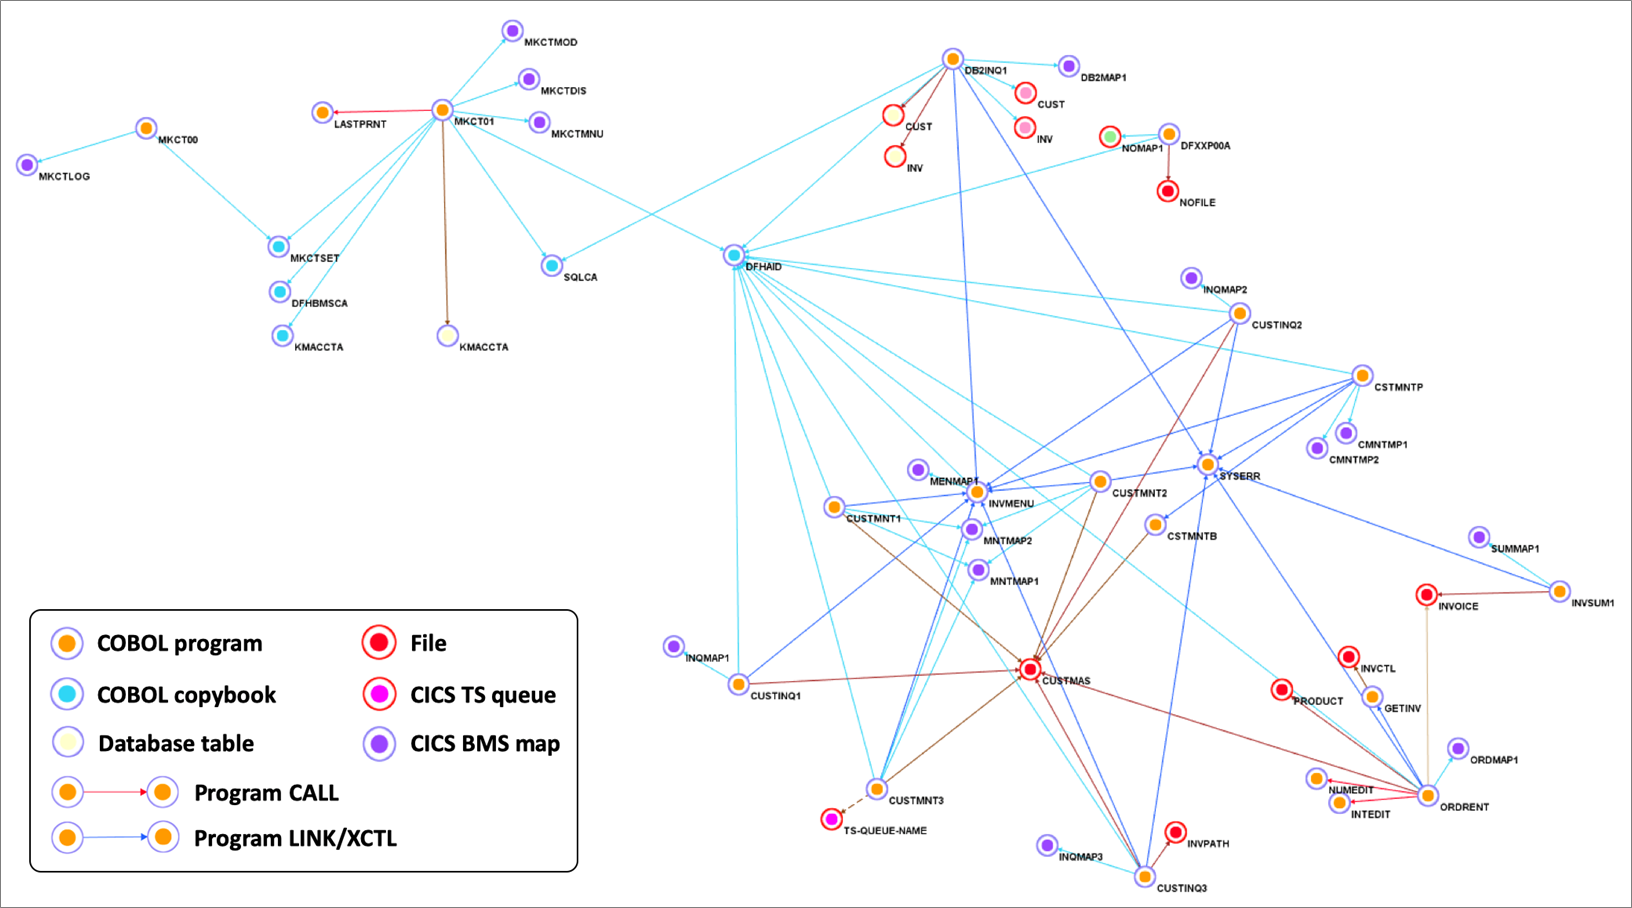
Figure 1 – Sample COBOL CICS application showing file dependencies.

We use Blu Age Analyzer to visualize the application components such as programs, copybooks, queues, and data elements.

Figure 1 above shows the Analyzer display. Each arrow represents a program call or dependency. You can see the COBOL programs using BMS maps for data entry and accessing data in DB2 database tables or VSAM files.

You can also identify the programs which are data-independent and those which access the same data file. This information helps define independent groupings that facilitate the migration into smaller services or even microservices.

This Analyzer view allows customers to identify the approach, groupings, work packages, and transitions for the automated refactoring.

In the next sections, we describe how to do the groupings and the transformation for three different target architectures: compute with Amazon Elastic Compute Cloud (Amazon EC2), containers with Amazon Elastic Kubernetes Service (Amazon EKS), and serverless functions with AWS Lambda.

Automated Refactoring to Elastic Compute

First, we transform the mainframe application to be deployed on Amazon EC2. This provides infrastructure agility with a large choice of instance types, horizontal scalability, auto scaling, some managed services, infrastructure automation, and cloud speed.

Amazon EC2 also provides some application agility with DevOps best practices, CI/CD pipeline, modern accessible data stores, and service-enabled programs.

Blu-Age-Serverless-2

Figure 2 – Overview of automated refactoring from mainframe to Amazon EC2.

Figure 2 above shows the automated refactoring of the mainframe application to Amazon EC2.

The DB2 tables and VSAM files are refactored to Amazon Aurora relational database. Amazon ElastiCache is used for in-memory temporary storage or for performance acceleration, and Amazon MQ takes care of the messaging communications.

Once refactored, the application becomes stateless and elastic across many duplicate Amazon EC2 instances that benefit from Auto Scaling Groups and Elastic Load Balancing (ELB). The application code stays monolithic in this first transformation.

With such monolithic transformation, all programs and dependencies are kept together. That means we create only one grouping.

Figure 3 below shows the yellow grouping that includes all application elements. Using Blu Age Analyzer, we define groupings by assigning a common tag to multiple application elements.

Blu-Age-Serverless-3

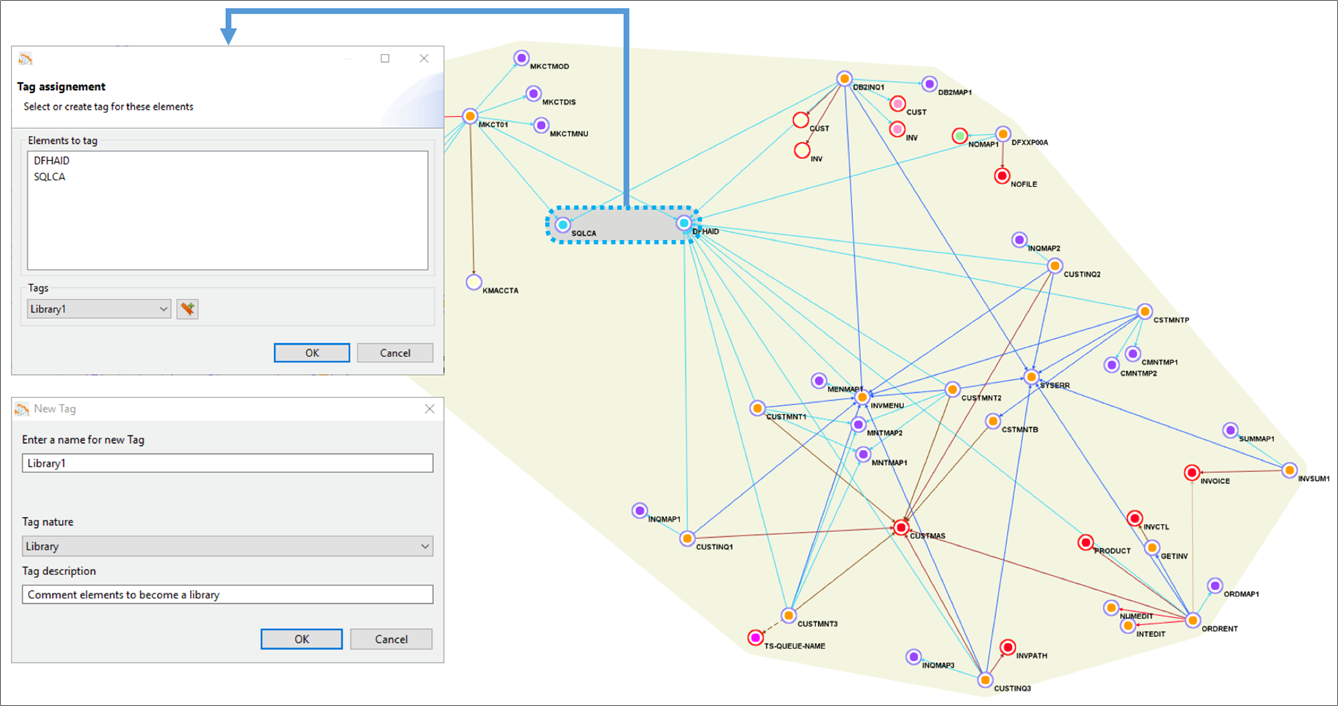
Figure 3 – Blu Age Analyzer with optional groupings for work packages and libraries.

With larger applications, it’s very likely we’d break down the larger effort by defining incremental work packages. Each work package is associated with one grouping and one tag.

Similarly, some shared programs or copybooks can be externalized and shared using a library. Each library is associated with one grouping and one tag. For example, in Figure 3 one library is created based on two programs, as shown by the grey grouping.

Ultimately, once the project is complete, all programs and work packages are deployed together within the same Amazon EC2 instances.

For each tag, we then export the corresponding application elements to Git.

Blu-Age-Serverless-4.1

Figure 4 – Blu Age Analyzer export to Git.

Figure 4 shows the COBOL programs, copybooks, DB2 Data Definition Language (DDL), and BMS map being exported to Git.

As you can see in Figure 5 below, the COBOL application elements are available in the Integrated Development Environment (IDE) for maintenance, or for new development and compilation.

Blu Age toolset allows maintaining the migrated code in either in COBOL or in Java.

Blu-Age-Serverless-5

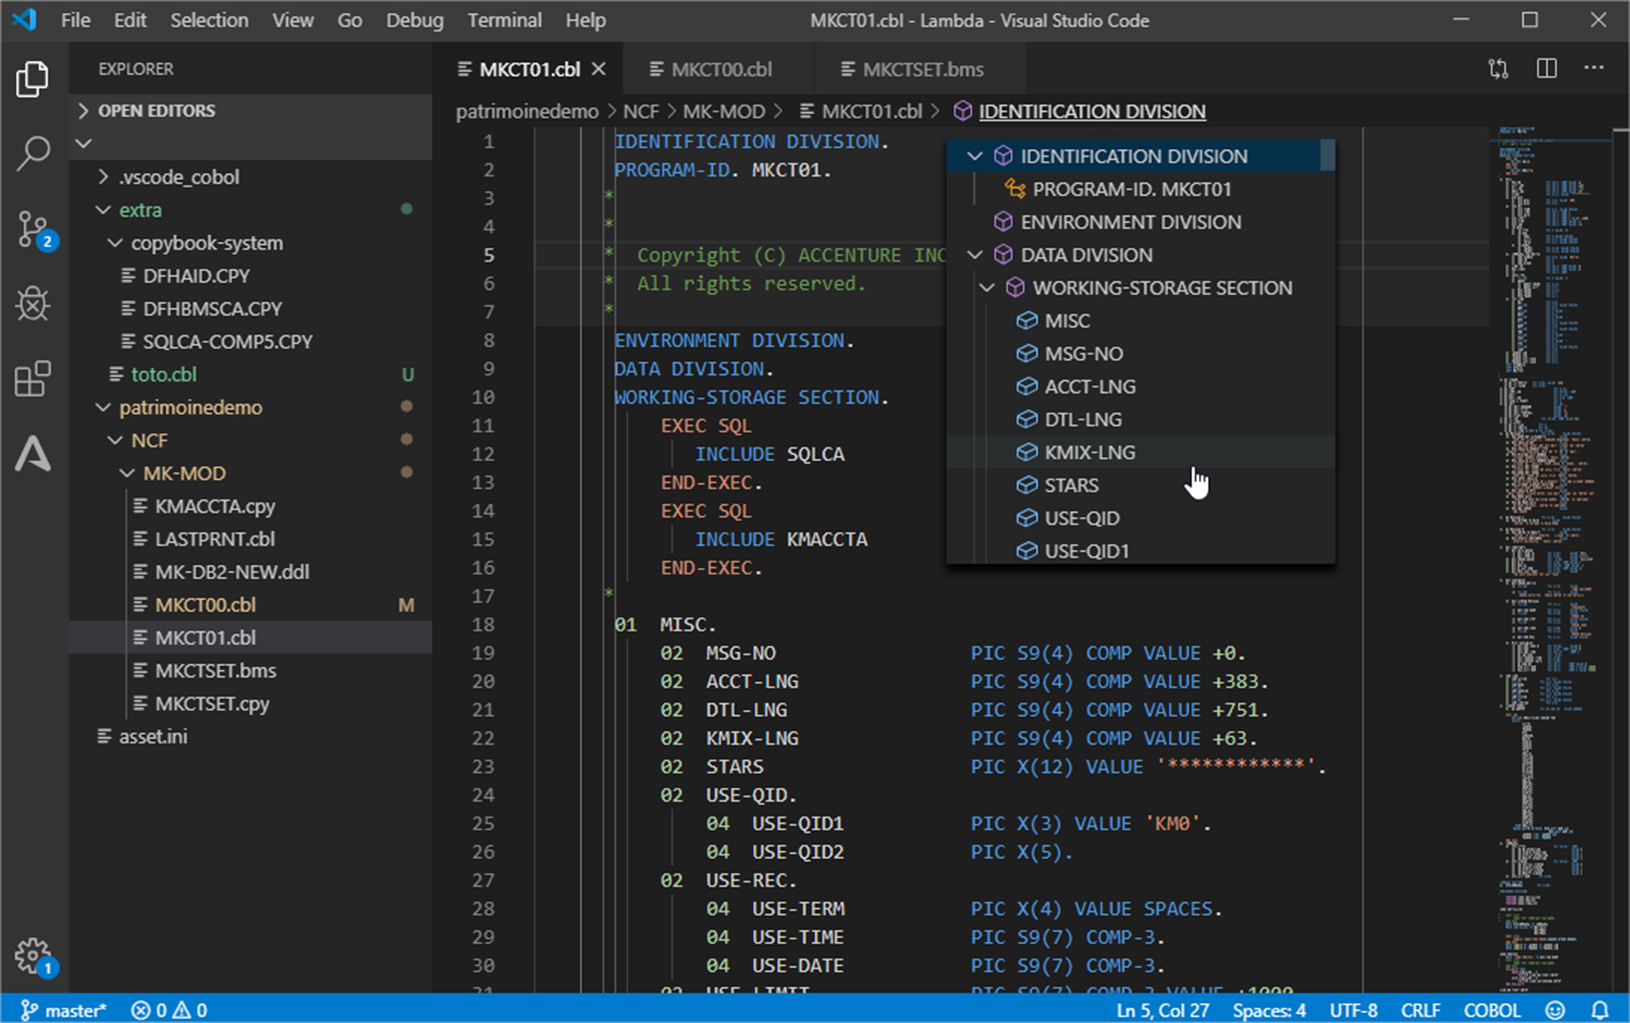
Figure 5 – Integrated Development Environment with COBOL application.

The code is recompiled and automatically packaged for the chosen target Amazon EC2 deployment.

During this packaging, the compute code is made stateless with any shared or persistent data externalized to data stores. This follows many of The Twelve-Factor App best practices that enable higher availability, scalability, and elasticity on the AWS Cloud.

In parallel, based on the code refactoring, the data from VSAM and DB2 z/OS is converted to the PostgreSQL-compatible edition of Amazon Aurora with corresponding data access queries conversions. Blu Age Velocity also generates the scripts for data conversion and migration.

Once deployed, the code and data go through unit, integration, and regression testing in order to validate functional equivalence. This is part of an automated CI/CD pipeline which also includes quality and security gates. The application is now ready for production on elastic compute.

Automated Refactoring to Containers

In this section, we increase agility by transforming the mainframe application to be deployed as different services in separate containers managed by Amazon EKS.

The application agility increases because the monolith is broken down into different services that can evolve and scale independently. Some services execute online transactions for users’ direct interactions. Some services execute batch processing. All services run in separate containers in Amazon EKS.

With such an approach, we can create microservices with both independent data stores and independent business functionalities. Read more about How to Peel Mainframe Monoliths for AWS Microservices with Blu Age.

Blu-Age-Serverless-6

Figure 6 – Overview of automated refactoring from mainframe to Amazon EKS.

Figure 6 shows the automated refactoring of the mainframe application to Amazon EKS. You could also use Amazon Elastic Container Service (Amazon ECS) and AWS Fargate.

The mainframe application monolith is broken down targeting different containers for various online transactions, and different containers for various batch jobs. Each service DB2 tables and VSAM files are refactored to their own independent Amazon Aurora relational database.

AWS App Mesh facilitates internal application-level communication, while Amazon API Gateway and Amazon MQ focus more on the external integration.

With the Blu Age toolset, some services can still be maintained and developed in COBOL while others can be maintained in Java, which simultaneously allows a polyglot architecture.

For the application code maintained in COBOL on AWS, Blu Age Serverless COBOL provides native integration COBOL APIs for AWS services such as Amazon Aurora, Amazon Relational Database Service (Amazon RDS), Amazon DynamoDB, Amazon ElastiCache, and Amazon Kinesis, among others.

With such refactoring, programs and dependencies are grouped into separate services. This is called service decomposition and means we create multiple groupings in Blu Age Analyzer.

Blu-Age-Serverless-7

Figure 7 – Blu Age Analyzer with two services groupings and one library grouping.

Figure 7 shows one service grouping in green, another service grouping in rose, and a library grouping in blue. Groupings are formalized with one tag each.

For each tag, we export the corresponding application elements to Git and open them in the IDE for compilation. We can create one Git project per tag providing independence and agility to individual service owner.

Blu-Age-Serverless-8

Figure 8 – COBOL program in IDE ready for compilation.

The Blu Age compiler for containers compiles the code and packages it into a Docker container image with all the necessary language runtime configuration for deployment and services communication.

The REST APIs for communication are automatically generated. The container images are automatically produced, versioned and stored into Amazon Elastic Container Registry (Amazon ECR), and the two container images are deployed onto Amazon EKS.

Blu-Age-Serverless-9

Figure 9 – AWS console showing the two container images created in Amazon ECR.

Figure 9 above shows the two new Docker container images referenced in Amazon ECR.

After going through data conversion and extensive testing similar to the previous section, the application is now ready for production on containers managed by Amazon EKS.

Automated Refactoring to Serverless Functions

Now, we can increase agility and cost efficiency further by targeting serverless functions in AWS Lambda.

Not only is the monolith broken down into separate services, but the services become smaller functions with no need to manage servers or containers. With Lambda, there’s no charge when the code is not running.

Not all programs are good use-cases for Lambda. Technical characteristics make Lambda better suited for short-lived lightweight stateless functions. For this reason, some services are deployed in Lambda while others are still deployed in containers or elastic compute.

For example, long-running batch processing cannot run in Lambda but they can run in containers. Online transactions or batch-specific short functions, on the other hand, can run in Lambda.

With this approach, we can create granular microservices with independent data stores and business functions.

Blu-Age-Serverless-10

Figure 10 – Overview of automated refactoring from mainframe to AWS Lambda.

Figure 10 shows the automated refactoring of the mainframe application to Lambda and Amazon EKS. Short-lived stateless transactions and programs are deployed in Lambda, while long-running or unsuitable programs run in Docker containers within Amazon EKS.

Amazon Simple Queue Service (SQS) is used for service calls within or across Lambda and Amazon EKS. Such architecture is similar to a cloud-native application architecture that’s much better positioned in the Cloud-Native Maturity Model.

With this refactoring, programs and dependencies are grouped into more separate services in Blu Age Analyzer.

Blu-Age-Serverless-11

Figure 11 – Blu Age Analyzer with two AWS Lambda groupings, on container grouping and one library grouping.

In Figure 11 above, the green grouping and yellow grouping are tagged for Lambda deployment. The rose grouping stays tagged for container deployment, while the blue grouping stays a library. Same as before, the code is exported tag after tag into Git, then opened within the IDE for compilation.

The compilation and deployment for Lambda does not create a container image, but it creates compiled code ready to be deployed on Blu Age Serverless COBOL layer for Lambda.

Here’s the Serverless COBOL layer added to the deployed functions.

Blu-Age-Serverless-12

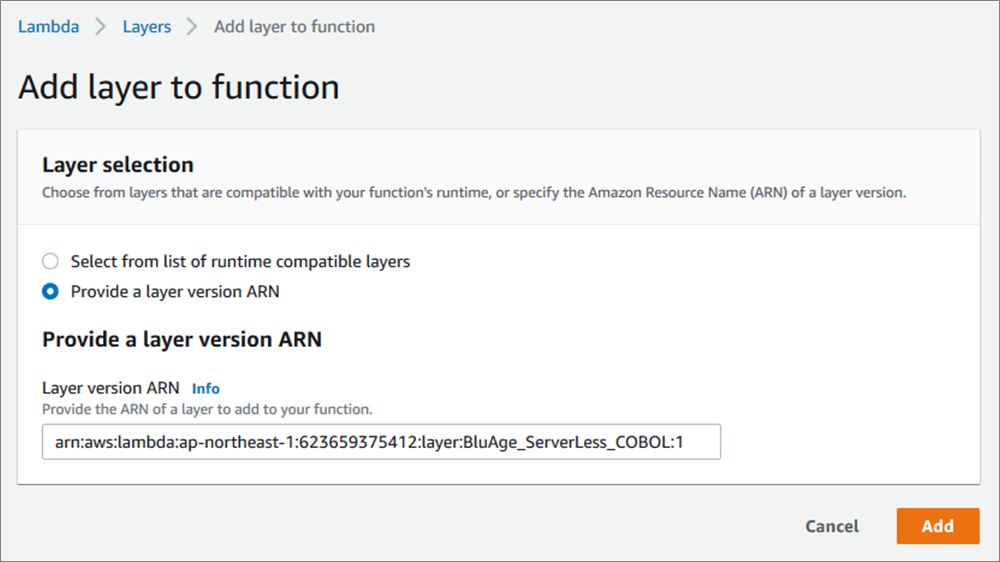
Figure 12 – Blu Age Serverless COBOL layer added to AWS Lambda function.

Now, here’s the two new Lambda functions created once the compiled code is deployed.

Blu-Age-Serverless-13

Figure 13 – AWS console showing the two AWS Lambda functions created.

After data conversion and thorough testing similar to the previous sections, the application is now ready for production on serverless functions and containers.

With business logic in Lambda functions, this logic can be invoked from many sources (REST APIs, messaging, object store, streams, databases) for innovations.

Incremental Transitions

Automated refactoring allows customers to accelerate modernization and minimize project risks on many dimensions.

On one side, the extensive automation for the full software stack conversion including code, data formats, dependencies provides functional equivalence preserving core business logic.

On the other side, the solution provides incremental transitions and accelerators tailored to the customer constraints and objectives:

  • Incremental transition from mainframe to AWS: As shown with Blu Age Analyzer, a large application migration is piece-mealed into small work packages with coherent programs and data elements. The migration does not have to be a big bang, and it can be executed incrementally over time.
    .
  • Incremental transition from COBOL to Java: Blu Age compilers and toolset supports maintaining the application code either in the original COBOL or Java.
    .
    All the deployment options described previously can be maintained similarly in COBOL or in Java and co-exist. That means you can choose to keep developing in COBOL if appropriate, and decide to start developing in Java when convenient facilitating knowledge transfer between developers.
    .
  • Incremental transition from elastic compute, to containers, to functions: Some customers prefer starting with elastic compute, while others prefer jumping straight to containers or serverless functions. Blu Age toolset has the flexibility to switch from one target to the other following the customer specific needs.
    .
  • Incremental transition from monolith to services and microservices: Peeling a large monolith is a long process, and the monolith can be kept and deployed on the various compute targets. When time comes, services or microservices are identified in Blu Age Analyzer, and then extracted and deployed on elastic compute, containers, or serverless functions.

From a timeline perspective, the incremental transition from mainframe to AWS is a short-term project with achievable return on investment, as shown on Figure 14.

Blu-Age-Serverless-14

Figure 14 – Mainframe to AWS transition timeline.

We recommend starting with a hands-on Proof-of-Concept (PoC) with customers’ real code. It’s the only way to prove the technical viability and show the outcome quality within 6 weeks.

Then, you can define work packages and incrementally refactor the mainframe application to AWS targeting elastic compute, containers, or serverless functions.

The full refactoring of a mainframe workload onto AWS can be completed in a year. As soon as services are refactored and in production on AWS, new integrations and innovations become possible for analytics, mobile, voice, machine learning (ML), or Internet of Things (IoT) use cases.

Summary

Blu Age mainframe automated refactoring provides the speed and flexibility to meet the agility needs of customers. It leverages the AWS quality of service for high security, high availability, elasticity, and rich system management to meet or exceed the mainframe workloads requirements.

While accelerating modernization, Blu Age toolset allows incremental transitions adapting to customers priorities. It accelerates mainframe modernization to containers or serverless functions

Blu Age also gives the option to keep developing in COBOL or transition smoothly to Java. It facilitates the identification and extraction of microservices.

For more details, visit the Serverless COBOL page and contact Blu Age to learn more.

.
Blu-Age-APN-Blog-CTA-1
.


Blu Age – APN Partner Spotlight

Blu Age is an APN Select Technology Partner that helps organizations enter the digital era by modernizing legacy systems while substantially reducing modernization costs, shortening project duration, and mitigating the risk of failure.

Contact Blu Age | Solution Overview | AWS Marketplace

*Already worked with Blu Age? Rate this Partner

*To review an APN Partner, you must be an AWS customer that has worked with them directly on a project.


What’s After the MEAN Stack?

$
0
0

Feed: MemSQL Blog.
Author: Rob Richardson.

The MEAN stack – MongoDB, Express.js, Angular.js, and Node.js – has served as a pattern for a wide variety of web development. But times have changed, and the components of the MEAN stack have failed to keep up with the times. Let’s take a look at how the MEAN stack superseded the previous stack, the LAMP stack, and at the options developers have now for delivering efficient Web applications.

Introduction

We reach for software stacks to simplify the endless sea of choices. The MEAN stack is one such simplification that worked very well in its time. Though the MEAN stack was great for the last generation, we need more; in particular, more scalability. The components of the MEAN stack haven’t aged well, and our appetites for cloud-native infrastructure require a more mature approach. We need an updated, cloud-native stack that can boundlessly scale as much as our users expect to deliver superior experiences.

Stacks

When we look at software, we can easily get overwhelmed by the complexity of architectures or the variety of choices. Should I base my system on Python?  Or is Go a better choice? Should I use the same tools as last time? Or should I experiment with the latest hipster toolchain? These questions and more stymie both seasoned and newbie developers and architects.

Some patterns emerged early on that help developers quickly provision a web property to get started with known-good tools. One way to do this is to gather technologies that work well together in “stacks.” A “stack” is not a prescriptive validation metric, but rather a guideline for choosing and integrating components of a web property. The stack often identifies the OS, the database, the web server, and the server-side programming language.

In the earliest days, the famous stacks were the “LAMP-stack” and the “Microsoft-stack”. The LAMP stack represents Linux, Apache, MySQL, and PHP or Python. LAMP is an acronym of these product names. All the components of the LAMP stack are open source (though some of the technologies have commercial versions), so one can use them completely for free. The only direct cost to the developer is the time to build the experiment.

The “Microsoft stack” includes Windows Server, SQL Server, IIS (Internet Information Services), and ASP (90s) or ASP.NET (2000s+). All these products are tested and sold together. 

Stacks such as these help us get started quickly. They liberate us from decision fatigue, so we can focus instead on the dreams of our start-up, or the business problems before us, or the delivery needs of internal and external stakeholders. We choose a stack, such as LAMP or the Microsoft stack, to save time.

In each of these two example legacy stacks, we’re producing web properties. So no matter what programming language we choose, the end result of a browser’s web request is HTML, JavaScript, and CSS delivered to the browser. HTML provides the content, CSS makes it pretty, and in the early days, JavaScript was the quick form-validation experience. On the server, we use the programming language to combine HTML templates with business data to produce rendered HTML delivered to the browser. 

We can think of this much like mail merge: take a Word document with replaceable fields like first and last name, add an excel file with columns for each field, and the engine produces a file for each row in the sheet.

As browsers evolved and JavaScript engines were tuned, JavaScript became powerful enough to make real-time, thick-client interfaces in the browser. Early examples of this kind of web application are Facebook and Google Maps. 

These immersive experiences don’t require navigating to a fresh page on every button click. Instead, we could dynamically update the app as other users created content, or when the user clicks buttons in the browser. With these new capabilities, a new stack was born: the MEAN stack.

What is the MEAN Stack?

The MEAN stack was the first stack to acknowledge the browser-based thick client. Applications built on the MEAN stack primarily have user experience elements built in JavaScript and running continuously in the browser. We can navigate the experiences by opening and closing items, or by swiping or drilling into things. The old full-page refresh is gone.

The MEAN stack includes MongoDB, Express.js, Angular.js, and Node.js. MEAN is the acronym of these products. The back-end application uses MongoDB to store its data as binary-encoded JavaScript Object Notation (JSON) documents. Node.js is the JavaScript runtime environment, allowing you to do backend, as well as frontend, programming in JavaScript. Express.js is the back-end web application framework running on top of Node.js. And Angular.js is the front-end web application framework, running your JavaScript code in the user’s browser. This allows your application UI to be fully dynamic. 

Unlike previous stacks, both the programming language and operating system aren’t specified, and for the first time, both the server framework and browser-based client framework are specified.

In the MEAN stack, MongoDB is the data store. MongoDB is a NoSQL database, making a stark departure from the SQL-based systems in previous stacks. With a document database, there are no joins, no schema, no ACID compliance, and no transactions. What document databases offer is the ability to store data as JSON, which easily serializes from the business objects already used in the application. We no longer have to dissect the JSON objects into third normal form to persist the data, nor collect and rehydrate the objects from disparate tables to reproduce the view. 

The MEAN stack webserver is Node.js, a thin wrapper around Chrome’s V8 JavaScript engine that adds TCP sockets and file I/O. Unlike previous generations’ web servers, Node.js was designed in the age of multi-core processors and millions of requests. As a result, Node.js is asynchronous to a fault, easily handling intense, I/O-bound workloads. The programming API is a simple wrapper around a TCP socket. 

In the MEAN stack, JavaScript is the name of the game. Express.js is the server-side framework offering an MVC-like experience in JavaScript. Angular (now known as Angular.js or Angular 1) allows for simple data binding to HTML snippets. With JavaScript both on the server and on the client, there is less context switching when building features. Though the specific features of Express.js’s and Angular.js’s frameworks are quite different, one can be productive in each with little cross-training, and there are some ways to share code between the systems.

The MEAN stack rallied a web generation of start-ups and hobbyists. Since all the products are free and open-source, one can get started for only the cost of one’s time. Since everything is based in JavaScript, there are fewer concepts to learn before one is productive. When the MEAN stack was introduced, these thick-client browser apps were fresh and new, and the back-end system was fast enough, for new applications, that database durability and database performance seemed less of a concern.

The Fall of the MEAN Stack

The MEAN stack was good for its time, but a lot has happened since. Here’s an overly brief history of the fall of the MEAN stack, one component at a time.

Mongo got a real bad rap for data durability. In one Mongo meme, it was suggested that Mongo might implement the PLEASE keyword to improve the likelihood that data would be persisted correctly and durably. (A quick squint, and you can imagine the XKCD comic about “sudo make me a sandwich.”) Mongo also lacks native SQL support, making data retrieval slower and less efficient. 

Express is aging, but is still the defacto standard for Node web apps and apis. Much of the modern frameworks — both MVC-based and Sinatra-inspired — still build on top of Express. Express could do well to move from callbacks to promises, and better handle async and await, but sadly, Express 5 alpha hasn’t moved in more than a year.

Angular.js (1.x) was rewritten from scratch as Angular (2+). Arguably, the two products are so dissimilar that they should have been named differently. In the confusion as the Angular reboot was taking shape, there was a very unfortunate presentation at an Angular conference. 

The talk was meant to be funny, but it was not taken that way. It showed headstones for many of the core Angular.js concepts, and sought to highlight how the presenters were designing a much easier system in the new Angular. 

Sadly, this message landed really wrong. Much like the community backlash to Visual Basic’s plans they termed Visual Fred, the community was outraged. The core tenets they trusted every day for building highly interactive and profitable apps were getting thrown away, and the new system wouldn’t be ready for a long time. Much of the community moved on to React, and now Angular is struggling to stay relevant. Arguably, Angular’s failure here was the biggest factor in React’s success — much more so than any React initiative or feature.

Nowadays many languages’ frameworks have caught up to the lean, multi-core experience pioneered in Node and Express. ASP.NET Core brings a similarly light-weight experience, and was built on top of libuv, the OS-agnostic socket framework, the same way Node was. Flask has brought light-weight web apps to Python. Ruby on Rails is one way to get started quickly. Spring Boot brought similar microservices concepts to Java. These back-end frameworks aren’t JavaScript, so there is more context switching, but their performance is no longer a barrier, and strongly-typed languages are becoming more in vogue.

As a further deterioration of the MEAN stack, there are now frameworks named “mean,” including mean.io and meanjs.org and others. These products seek to capitalize on the popularity of the “mean” term. Sometimes it offers more options on the original MEAN products, sometimes scaffolding around getting started faster, sometimes merely looking to cash in on the SEO value of the term.

With MEAN losing its edge, many other stacks and methodologies have emerged.

The JAM Stack

The JAM stack is the next evolution of the MEAN stack. The JAM stack includes JavaScript, APIs, and Markup. In this stack, the back-end isn’t specified – neither the webserver, the back-end language, or the database.

In the JAM stack we use JavaScript to build a thick client in the browser, it calls APIs, and mashes the data with Markup — likely the same HTML templates we would build in the MEAN stack. The JavaScript frameworks have evolved as well. The new top contenders are React, Vue.js, and Angular, with additional players from Svelte, Auralia, Ember, Meteor, and many others. 

The frameworks have mostly standardized on common concepts like virtual dom, 1-way data binding, and web components. Each framework then combines these concepts with the opinions and styles of the author.

The JAM stack focuses exclusively on the thick-client browser environment, merely giving a nod to the APIs, as if magic happens behind there. This has given rise to backend-as-a-service products like Firebase, and API innovations beyond REST including gRPC and GraphQL. But, just as legacy stacks ignored the browser thick-client, the JAM stack marginalizes the backend, to our detriment.

Maturing Application Architecture

As the web and the cloud have matured, as system architects, we have also matured in our thoughts of how to design web properties.

As technology has progressed, we’ve gotten much better at building highly scalable systems. Microservices offer a much different application model where simple pieces are arranged into a mesh. Containers offer ephemeral hardware that’s easy to spin up and replace, leading to utility computing.

As consumers and business users of systems, we almost take for granted that a system will be always on and infinitely scalable. We don’t even consider the complexity of geo-replication of data or latency of trans-continental communication. If we need to wait more than a second or two, we move onto the next product or the next task.

With these maturing tastes, we now take for granted that an application can handle near infinite load without degradation to users, and that features can be upgraded and replaced without downtime. Imagine the absurdity if Google Maps went down every day at 10 pm so they could upgrade the system, or if Facebook went down if a million people or more posted at the same time.

We now take for granted that our applications can scale, and the naive LAMP and MEAN stacks are no longer relevant.

Characteristics of the Modern Stack

What does the modern stack look like?  What are the elements of a modern system?  I propose a modern system is cloud-native, utility-billed, infinite-scale, low-latency, user-relevant using machine learning, stores and processes disparate data types and sources, and delivers personalized results to each user. Let’s dig into these concepts.

A modern system allows boundless scale. As a business user, I can’t handle if my system gets slow when we add more users. If the site goes viral, it needs to continue serving requests, and if the site is seasonally slow, we need to turn down the spend to match revenue. Utility billing and cloud-native scale offers this opportunity. Mounds of hardware are available for us to scale into immediately upon request. If we design stateless, distributed systems, additional load doesn’t produce latency issues.

A modern system processes disparate data types and sources. Our systems produce logs of unstructured system behavior and failures. Events from sensors and user activity flood in as huge amounts of time-series events. Users produce transactions by placing orders or requesting services. And the product catalog or news feed is a library of documents that must be rendered completely and quickly. As users and stakeholders consume the system’s features, they don’t want or need to know how this data is stored or processed. They need only see that it’s available, searchable, and consumable.

A modern system produces relevant information. In the world of big data, and even bigger compute capacity, it’s our task to give users relevant information from all sources. Machine learning models can identify trends in data, suggesting related activities or purchases, delivering relevant, real-time results to users. Just as easily, these models can detect outlier activities that suggest fraud. As we gain trust in the insights gained from these real-time analytics, we can empower the machines to make decisions that deliver real business value to our organization.

MemSQL is the Modern Stack’s Database

Whether you choose to build your web properties in Java or C#, in Python or Go, in Ruby or JavaScript, you need a data store that can elastically and boundlessly scale with your application. One that solves the problems that Mongo ran into – that scales effortlessly, and that meets ACID guarantees for data durability. 

We also need a database that supports the SQL standard for data retrieval. This brings two benefits: a SQL database “plays well with others,” supporting the vast number of tools out there that interface to SQL, as well as the vast number of developers and sophisticated end users who know SQL code. The decades of work that have gone into honing the efficiency of SQL implementations is also worth tapping into. 

These requirements have called forth a new class of databases, which go by a variety of names; we will use the term NewSQL here. A NewSQL database is distributed, like Mongo, but meets ACID guarantees, providing durability, along with support for SQL. CockroachDB and Google Spanner are examples of NewSQL databases. 

We believe that MemSQL brings the best SQL, distributed, and cloud-native story to the table. At the core of MemSQL is the distributed database. In the database’s control plane is a master node and other aggregator nodes responsible for splitting the query across leaf nodes, and combining the results into deterministic data sets. ACID-compliant transactions ensure each update is durably committed to the data partitions, and available for subsequent requests. In-memory skiplists speed up seeking and querying data, and completely avoid data locks.

MemSQL Helios delivers the same boundless scale engine as a managed service in the cloud. No longer do you need to provision additional hardware or carve out VMs. Merely drag a slider up or down to ensure the capacity you need is available.

MemSQL is able to ingest data from Kafka streams, from S3 buckets of data stored in JSON, CSV, and other formats, and deliver the data into place without interrupting real-time analytical queries. Native transforms allow shelling out into any process to transform or augment the data, such as calling into a Spark ML model.

MemSQL stores relational data, stores document data in JSON columns, provides time-series windowing functions, allows for super-fast in-memory rowstore tables snapshotted to disk and disk-based columnstore data, heavily cached in memory.

As we craft the modern app stack, include MemSQL as your durable, boundless cloud-native data store of choice.

Conclusion

Stacks have allowed us to simplify the sea of choices to a few packages known to work well together. The MEAN stack was one such toolchain that allowed developers to focus less on infrastructure choices and more on developing business value. 

Sadly, the MEAN stack hasn’t aged well. We’ve moved on to the JAM stack, but this ignores the back-end completely. 

As our tastes have matured, we assume more from our infrastructure. We need a cloud-native advocate that can boundlessly scale, as our users expect us to deliver superior experiences. Try MemSQL for free today, or contact us for a personalized demo.

4 principles of analytics you cannot ignore

$
0
0

Feed: SAS Blogs.
Author: Oliver Schabenberger.

Maybe you are new to AI and analytics. Or maybe you have been working with data and analytics for decades, even before we called this work data science or decision science.

As the industry has broadened from statistics and analytics to big data and artificial intelligence, some things have remained constant.

I call these foundational truths the Principles of Analytics. They inform our approach to data and analytics, and they manifest themselves in our products and services.

My hope is that sharing them here will inform your approach to data and analytics, too, and help guide your digital transformation and decision processes.

The four principles of analytics are:

  1. Analytics follows the data, analytics everywhere.
  2. Analytics is more than algorithms.
  3. Democratization of analytics; analytics for everyone.
  4. Analytics differentiates.

Principle 1: Analytics follows the data, analytics everywhere

Data are a resource. If you are not analyzing it, it is an unused resource. At SAS, we often say, “Data without analytics is value not yet realized.”

Whether your data are on-premises, in a public or private cloud, or at the edges of the network – analytics needs to be there with it.
                       Tweet this thought

Naturally, then, wherever there is data, there needs to be analytics.

But what does that mean today when we are generating more data and more diverse data than ever before? And all of that data streams or moves about many different networks.

The first principle of analytics is about bringing the right analytics technology to the right place at the right time. Whether your data are on-premises, in a public or private cloud, or at the edges of the network – analytics needs to be there with it.

If data moves to the cloud, analytics moves there with it. If data streams from the edge, analytics is there too.

The first principle manifests itself in:

  • Analytics pushed aggressively to the edge in devices, network routers, machines, health care equipment, cars, phones and more.
  • Analytics integrated with cloud storage and cloud computing.
  • Software that supports cloud-native and on-premises environments.
  • An emphasis on data integration, data quality, data privacy and data security.

Principle 2: Analytics is more than algorithms

You should pay great attention to the quality, robustness and performance of your algorithms. But the value of analytics is not in the features and functions of the algorithm – not anymore. The value is in solving data-driven business problems.

The analytics platform is a commodity – everybody has algorithms. But operationalizing analytics is not a commodity. Everybody is challenged with bringing analytics to life. When you deploy analytics in production, it drives value and decisions.

The game has changed. Data science teams are no longer measured by the models they build but by the business value they generate. If you can deploy and use the results of your algorithms faster and more strategically than others, you have an advantage.

Data science teams are no longer measured by the models they build but by the business value they generate. Click To Tweet

How can you gain that advantage? Develop enterprise-grade analytics processes that are scalable, flexible, integrated, governed and operational. These characteristics can be just as important as the algorithms themselves.

The second principle manifests itself in:

  • Creating models with a deployment scenario in mind.
  • Collaboration between data scientists and IT for faster deployment.
  • Integrating analytics products with a visual suite of user-friendly tools.
  • Model governance that integrates and supports open source programming languages and analytic assets.

Principle 3: Democratization of analytics; analytics for everyone

Digital transformation is an ongoing challenge that almost all organizations face. Data and analytics now play a strategic role in digital transformation. But you will not benefit from its impact unless data and analytics can scale beyond the data science team.

You need to enable analytics skills at all tiers of your organization, especially in those areas that have more domain knowledge that can be applied to analytics.

Making data and analytics available to everyone is crucial for successful analytics. I refer to this as “the democratization of analytics,” and it manifests itself in many ways:

  • Visualization tools for low-code and no-code programming.
  • Augmented analytics supports users through natural language processing and automation.
  • Automation of data management and machine learning.
  • Analytics and AI as supporting technology.
  • Open source integration.
  • Educational programs that broaden analytic skills.

Principle 4: Analytics differentiates

In a world where everyone has data, it’s what you do with that data that matters.

How can you differentiate with analytics? You use analytics to identify what data has the most value. You build better models than your competitors. You deploy those models faster. And you use advanced analytics – like AI, optimization and forecasting – in the areas that most differentiate your company.

Most importantly, you have to keep asking yourself: Where can we improve with analytics? What markets can we disrupt? Where can we automate and support performance breakthroughs?

Where can you bring analytics to connected devices or machines to profit from the Internet of Things?

If you are building customer intelligence models, how can you improve digital marketing through analytics and optimization?

In retail, how can you optimize prices, markdowns, assortment, fulfillment and revenue with analytics?

The fourth principle manifests itself in many ways:

  • Analytics applied to areas of the business where it will have the most impact.
  • Data and analytics strategies that expand the successful use of analytics projects throughout the organization.
  • A culture dedicated to digital transformation and analytical thinking.
  • New business opportunities from monetizing data and disrupting existing systems with analytics.

Conclusion

Why do these principles matter to you? Because even as analytics evolves and your industry transforms, these principles stay the same. They provide an internal compass that can inform your approach to data and analytics and fuel your successful digital transformation.

Register to learn more about the principles of analytics at SAS Global Forum

How to perform secondary processor over-the-air updates with FreeRTOS

$
0
0

Feed: The Internet of Things on AWS – Official Blog.
Author: Manish Talreja.

Many embedded architectures include a connectivity processor connected to one or more secondary processors that perform business logic. The ability to perform secondary processor over-the-air (OTA) updates is just as critical as updating the connectivity processor. This is because it allows for low-cost patching of bugs and security vulnerabilities as well as delivering new features to the device.

Image that shows an example device with a primary connectivity processor connected to AWS IoT and multiple secondary processors connected via a serial interface

FreeRTOS is an open source, real-time operating system for microcontrollers that makes small, low-power edge devices easy to program, deploy, secure, connect, and manage. AWS IoT Device Management makes it easy to securely register, organize, monitor, and remotely manage IoT devices at scale. AWS IoT Device Management provides an OTA Update Manager service to securely create and manage updates across a fleet of devices. The service works with the FreeRTOS OTA agent library by digitally signing the firmware, converting the file into an MQTT stream using the streaming API, and delivering the firmware to the device using AWS IoT jobs. The OTA agent library allows the reuse of an MQTT connection over TLS to reduce memory consumption on the connectivity processor.

In this post, we show you how to use the fileId parameter to deliver updates to the secondary processor. This post is not specific to any hardware and can be adapted to any system that runs FreeRTOS 201908.00 or later. For additional details on how to set up OTA using FreeRTOS and AWS IoT Device Management, refer to the FreeRTOS OTA tutorial.

Reference architecture overview

The following architecture diagram describes the flow of the secondary processor update from AWS IoT through a connectivity processor. The device runs FreeRTOS on the connectivity processor and has a serial interface such as SPI connected to the secondary processor. An authorized operator securely uploads the firmware to an Amazon S3 bucket and initiates the OTA update. The firmware file is signed using a digital certificate and a stream is created. An AWS IoT job is then created to send the firmware update to the device. The device’s connectivity processor identifies that the firmware update is one destined for the secondary processor and sends the update over the serial interface.

Image that shows the general architecture for the flow of the secondary processor update from AWS IoT through a connectivity processor.

Make firmware changes

FreeRTOS includes code that demonstrates how to perform OTA updates. You can find out details about how the demo works in the OTA updates demo application documentation. You can also download changes to the OTA demo from this code link and follow along after applying the patch.

OTA for a processor is typically handled by a Microcontroller Unit (MCU) vendor using guidelines listed in the OTA porting guide. The MCU vendor implements functions in the Platform Abstraction Layer (PAL) to perform the update. The patch prevents you from disrupting the firmware updates to the connectivity processor and overriding the behavior for secondary processor updates. The patch file previously provided lets you accomplish the following:

  1. Provide function overrides to the PAL layer. If the firmware is intended for the connectivity processor, the vendor-supplied PAL functions are called. Otherwise, the function allows you to send the update to the secondary processor using the overrides. These functions have been left empty so that hardware-specific transfers can be performed as needed by your platform.
  2. Override the PAL layer to call the function overrides using the internal OTA agent initialization function:
OTA_AgentInit_internal(xConnection.xMqttConnection, (const uint8_t *)(clientcredentialIOT_THING_NAME), &otaCallbacks, (TickType_t)~0);

Here are some items that you might need to adjust in the patch for your application:

  • Initialize communication with the secondary processor before initializing the OTA agent.
  • Check the file ID in the code to identify which processor is being updated. This file ID must match the ID sent in the script described in the next section. When an OTA update is created from the console, the file ID sent down is 0. Do not use 0 for any secondary processor updates.
  • Ensure that each of the callbacks return the appropriate error. For example, in the prvPAL_CreateFileForRx_customer callback, you might want to put the secondary processor into a known state to start receiving updates. If the state change fails, the callback should return an error.
  • Ensure that you return back eOTA_PAL_ImageState_Valid as the current platform image state on startup and eOTA_PAL_ImageState_PendingCommit when the platform state is set to eOTA_ImageState_Testing by the OTA agent state machine.
  • Ensure that the secondary processor is updated by checking the version number in the self-test routine. There is no explicit check done by the OTA state machine to ensure that the secondary processor updated.

To ensure that you are running the demo correctly, be sure to make the following changes:

  1. Configure your AWS environment by setting up storage and code-signing certificate. You can follow Steps 1 and 2 in Perform OTA Updates on Espressif ESP32 using FreeRTOS Bluetooth Low Energy.
  2. Locate the aws_demo_config.h for your platform. For example, for ESP32, this file is located in vendors/espressif/boards/esp32/aws_demos/config_files/
    • Define CONFIG_OTA_UPDATE_DEMO_ENABLED and comment out any other demo defines.
  3. Modify demos/include/aws_clientcredential.h:
    • Adjust the endpoint url in clientcredentialMQTT_BROKER_ENDPOINT[]
    • Adjust the thing name in clientcredentialIOT_THING_NAME
  4. Modify demos/include/aws_clientcredential_keys.h:
    • Add the device certificate to the keyCLIENT_CERTIFICATE_PEM define.
    • Add the device private key to the keyCLIENT_PRIVATE_KEY_PEM define.
  5. Modify demos/include/aws_ota_codesigner_certificate.h:
    • Adjust signingcredentialSIGNING_CERTIFICATE_PEM with the certificate that will be used to sign the firmware binary file. If you need more details on how to create the certificate, follow instructions in the first step.

Once the firmware is programmed, the OTA agent should continue to function normally for the connectivity processor. At the same time, it should also allow you to provide the OTA update to your secondary processor. You should see the following prints on the debug console of the connectivity processor:

12 309 [iot_thread] OTA demo version 0.9.2
13 309 [iot_thread] Creating MQTT Client...
----
21 823 [iot_thread] Connected to broker.
22 824 [iot_thread] [OTA_AgentInit_internal] OTA Task is Ready.
23 825 [OTA Agent Task] [prvOTAAgentTask] Called handler. Current State [Ready] Event [Start] New state [RequestingJob]
----
56 924 [iot_thread] State: Ready  Received: 1   Queued: 0   Processed: 0   Dropped: 0
57 1024 [iot_thread] State: WaitingForJob  Received: 1   Queued: 0   Processed: 0   Dropped: 0
58 1124 [iot_thread] State: WaitingForJob  Received: 1   Queued: 0   Processed: 0   Dropped: 0

At this point, your device is ready to receive an OTA update.

Set up the OTA update script

Once you have set up the firmware to allow for secondary processor updates, you must set up the cloud to transmit these updates to the device. The following steps walk you through how to initiate the OTA update to your secondary processor:

  1. Install prerequisites:
    pip3 install boto3
    pip3 install pathlib
  2. Get the OTA script from this code link.
  3. Run the script with a fileId greater than 0 and by providing the file location for the secondary processor binary.
  4. Help can be obtained by issuing:
    python3 start_ota_stream.py —h
    usage: start_ota_stream.py [-h] [--fileId FILEID] —profile PROFILE
    [--region REGION] [—account ACCOUNT]
    [--devicetype DEVICETYPE] --name NAME —role ROLE
    --s3bucket S3BUCKET —otasigningprofile
    OTASIGNINGPROFILE —signingcertificateid
    SIGNINGCERTIFICATEID [—codelocation CODELOCATION]
    [—filelocation FILELOCATION]
    
    Script to start OTA update
    
    optional arguments:
    -h, --help show this help message and exit
    --fileId FILEID ID of file being streamed to the device
    --profile PROFILE Profile name created using aws configure
    --region REGION Region
    --account ACCOUNT Account ID
    --devicetype DEVICETYPE
    thing|group
    --name NAME Name of thing/group
    --role ROLE Role for OTA updates
    --s3bucket S3BUCKET S3 bucket to store firmware updates
    --otasigningprofile OTASIGNINGPROFILE
    Signing profile to be created or used
    --signingcertificateid SIGNINGCERTIFICATEID
    certificate id (not arn) to be used
    --codelocation CODELOCATION
    base FreeRTOS folder location (can be relative) when
    fileId is 0
    --filelocation FILELOCATION
    OTA update file location when fileId is greater than 0
    
  5. Example execution:
    python3 start_ota_stream.py --profile otausercf --name mythingname --role ota_role --s3bucket ota-update-bucket --otasigningprofile signingprofile --signingcertificateid  --fileId 1 --filelocation update.bin
    
    Certificate ARN: arn:aws:acm:us-east-1:123456789012:certificate/cert-uuid
    Using App Location: update.bin
    Build File Name: update.bin
    Searching for profile signingprofile
    Found Profile signingprofile in account
    Waiting for signing job to completeOTA Update Status: {'ResponseMetadata': {'RequestId': '2c910ef5-1df5-4df6-8fe9-ddc3c46c68d2', 'HTTPStatusCode': 200, 'HTTPHeaders': {'date': 'Tue, 07 Jan 2020 19:53:48 GMT', 'content-type': 'application/json', 'content-length': '184', '
    connection': 'keep-alive', 'x-amzn-requestid': '2c910ef5-1df5-4df6-8fe9-ddc3c46c68d2', 'access-control-allow-origin': '*', 'x-amz-apigw-id': 'F8g4CFECoAMFz5g=', 'x-amzn-trace-id': 'Root=1-5e14e1cc-1fb61a4d9261e6b0602290c9'}, 'RetryAttem
    pts': 0}, 'otaUpdateId': 'device-8673-0-0-0', 'otaUpdateArn': 'arn:aws:iot:us-east-1:123456789012:otaupdate/device-8673-0-0-0', 'otaUpdateStatus': 'CREATE_PENDING'}
    
  6. You should see the update start in the console. Here are some prints you see in the debug console of the device:
    75 2767 [OTA Agent Task] [prvParseJobDoc] Size of OTA_FileContext_t [64]
    76 2767 [OTA Agent Task] [prvParseJSONbyModel] Extracted parameter [ jobId: AFR_OTA-device-58124-0-0-0 ]
    77 2767 [OTA Agent Task] [prvParseJSONbyModel] Extracted parameter [ protocols: ["MQTT"] ]
    78 2767 [OTA Agent Task] [prvParseJSONbyModel] Extracted parameter [ streamname: device-8673-0-0-0 ]
    79 2767 [OTA Agent Task] [prvParseJSONbyModel] Extracted parameter [ filepath: update.bin ]
    80 2767 [OTA Agent Task] [prvParseJSONbyModel] Extracted parameter [ filesize: 10446 ]
    81 2767 [OTA Agent Task] [prvParseJSONbyModel] Extracted parameter [ fileid: 1 ]
    82 2767 [OTA Agent Task] [prvParseJSONbyModel] Extracted parameter [ certfile: /cert.pem ]
    83 2767 [OTA Agent Task] [prvParseJSONbyModel] Extracted parameter [ sig-sha256-ecdsa: MEUCIQDNRumLRyXqUM3Z2wa71/LV4ufv... ]
    84 2767 [OTA Agent Task] [prvParseJobDoc] Job was accepted. Attempting to start transfer.
    85 2767 [OTA Agent Task] [prvPAL_GetPlatformImageState_customer] OTA Demo for secondary processor.
    86 2767 [OTA Agent Task] [prvPAL_CreateFileForRx_customer] OTA Demo for secondary processor.
    ----
    96 2781 [OTA Agent Task] [prvRequestFileBlock_Mqtt] OK: $aws/things/mythingname/streams/device-8673-0-0-0/get/cbor
    97 2781 [OTA Agent Task] [prvOTAAgentTask] Called handler. Current State [RequestingFileBlock] Event [RequestFileBlock] New state [WaitingForFileBlock]
    98 2805 [OTA Agent Task] [prvIngestDataBlock] Received file block 0, size 4096
    99 2805 [OTA Agent Task] [prvPAL_WriteBlock_customer] OTA Demo for secondary processor.
    ----
    108 2816 [OTA Agent Task] [prvIngestDataBlock] Received final expected block of file.
    109 2816 [OTA Agent Task] [prvStopRequestTimer] Stopping request timer.
    110 2816 [OTA Agent Task] [prvPAL_CloseFile_customer] Received prvPAL_CloseFile_customer inside OTA Demo for secondary processor.
    111 2816 [OTA Agent Task] [prvIngestDataBlock] File receive complete and signature is valid.
    ----
    124 2833 [iot_thread] State: WaitingForJob  Received: 5   Queued: 0   Processed: 0   Dropped: 0
    125 2833 [OTA Agent Task] [prvPAL_ActivateNewImage_customer] OTA Demo for secondary processor.
    

Once the OTA update is complete, the device restarts as needed by the OTA update process and tries to connect with the updated firmware. If the connection succeeds, the updated firmware is marked as active, and you should see the updated version in the console:

58 866 [OTA Task] [prvUpdateJobStatus] Msg: {"status":"SUCCEEDED","statusDetails":{"reason":"accepted v0.9.2"}}

Conclusion

In this blog post, we described how you can perform OTA updates to secondary processors with AWS IoT Device Management and FreeRTOS. This mechanism can be expanded to upgrade any number of processors attached to a connectivity processor using an existing MQTT connection to AWS IoT Core.

We hope that you are able to use the steps provided in this post on your platform. Please visit this link to learn more about FreeRTOS.

Enterprise Architecture and Business Process Modeling Tools Have Evolved

$
0
0

Feed: erwin Expert Blog – erwin, Inc..
Author: Zak Cole.

Enterprise architecture (EA) and business process (BP) modeling tools are evolving at a rapid pace. They are being employed more strategically across the wider organization to transform some of business’s most important value streams.

Recently, Glassdoor named enterprise architecture the top tech job in the UK, indicating its increasing importance to the enterprise in the tech and data-driven world.

Whether documenting systems and technology, designing processes and value streams, or managing innovation and change, organizations need flexible but powerful EA and BP tools they can rely on for collecting relevant information for decision-making.

It’s like constructing a building or even a city – you need a blueprint to understand what goes where, how everything fits together to support the structure, where you have room to grow, and if it will be feasible to knock down any walls if you need to.

Data-Driven Enterprise Architecture

Without a picture of what’s what and the interdependencies, your enterprise can’t make changes at speed and scale to serve its needs.

Recognizing this evolution, erwin has enhanced and repackaged its EA/BP platform as erwin Evolve.

The combined solution enables organizations to map IT capabilities to the business functions they support and determine how people, processes, data, technologies and applications interact to ensure alignment in achieving enterprise objectives.

These initiatives can include digital transformation, cloud migration, portfolio and infrastructure rationalization, regulatory compliance, mergers and acquisitions, and innovation management.

Regulatory Compliance Through Enterprise Architecture & Business Process Modeling Software

A North American banking group is using erwin Evolve to integrate information across the organization and provide better governance to boost business agility. Developing a shared repository was key to aligning IT systems to accomplish business strategies, reducing the time it takes to make decisions, and accelerating solution delivery.

It also operationalizes and governs mission-critical information by making it available to the wider enterprise at the right levels to identify synergies and ensure the appropriate collaboration.

EA and BP modeling are both critical for risk management and regulatory compliance, a major concern for financial services customers like the one above when it comes to ever-changing regulations on money laundering, fraud and more. erwin helps model, manage and transform mission-critical value streams across industries, as well as identify sensitive information.

Additionally, when thousands of employees need to know what compliance processes to follow, such as those associated with regulations like the General Data Protection Regulation (GDPR), ensuring not only access to proper documentation but current, updated information is critical.

The Advantages of Enterprise Architecture & Business Process Modeling from erwin

The power to adapt the EA/BP platform leads global giants in critical infrastructure, financial services, healthcare, manufacturing and pharmaceuticals to deploy what is now erwin Evolve for both EA and BP use cases. Its unique advantages are:

  • Integrated, Web-Based Modeling & Diagramming: Harmonize EA/BP capabilities with a robust, flexible and web-based modeling and diagramming interface easy for all stakeholders to use.
  • High-Performance, Scalable & Centralized Repository: See an integrated set of views for EA and BP content in a central, enterprise-strength repository capable of supporting thousands of global users.
  • Configurable Platform with Role-Based Views: Configure the metamodel, frameworks and user interface for an integrated, single source of truth with different views for different stakeholders based on their roles and information needs.
  • Visualizations & Dashboards: View mission-critical data in the central repository in the form of user-friendly automated visualizations, dashboards and diagrams.
  • Third-Party Integrations: Synchronize data with such enterprise applications as CAST, Cloud Health, RSA Archer, ServiceNow and Zendesk.
  • Professional Services: Tap into the knowledge of our veteran EA and BP consultants for help with customizations and integrations, including support for ArchiMate.

erwin Evolve 2020’s specific enhancements include web-based diagramming for non-IT users, stronger document generation and analytics, TOGAF support, improved modeling and navigation through inferred relationships, new API extensions, and modular packaging so customers can choose the components that best meet their needs.

erwin Evolve is also part of the erwin EDGE with data modeling, data catalog and data literacy capabilities for overall data intelligence.

Enterprise architecture business process

How Siemens built a fully managed scheduling mechanism for updates on Amazon S3 data lakes

$
0
0

Feed: AWS Big Data Blog.

Siemens is a global technology leader with more than 370,000 employees and 170 years of experience. To protect Siemens from cybercrime, the Siemens Cyber Defense Center (CDC) continuously monitors Siemens’ networks and assets. To handle the resulting enormous data load, the CDC built a next-generation threat detection and analysis platform called ARGOS. ARGOS is a hybrid-cloud solution that makes heavy use of fully managed AWS services for streaming, big data processing, and machine learning.

Users such as security analysts, data scientists, threat intelligence teams, and incident handlers continuously access data in the ARGOS platform. Further, various automated components update, extend, and remove data to enrich information, improve data quality, enforce PII requirements, or mutate data due to schema evolution or additional data normalization requirements. Keeping the data always available and consistent presents multiple challenges.

While object-based data lakes are highly beneficial from a cost perspective compared to traditional transactional databases in such scenarios, they hardly allow for atomic updates or require highly complex and costly extensions. To overcome this problem, Siemens designed a solution that enables atomic file updates on Amazon S3-based data lakes without compromising query performance and availability.

This post presents this solution, which is an easy-to-use scheduling service for S3 data update tasks. Siemens uses it for multiple purposes, including pseudonymization, anonymization, and removal of sensitive data. This post demonstrates how to use the solution to remove values from a dataset after a predefined amount of time. Adding further data processing tasks is straightforward because the solution has a well-defined architecture and the whole stack consists of fewer than 200 lines of source code. It is solely based on fully managed AWS services and therefore achieves minimal operational overhead.

Architecture overview

This post uses an S3-based data lake with continuous data ingestion and Amazon Athena as query mechanism. The goal is to remove certain values after a predefined time automatically after ingestion. Applications and users consuming the data via Athena are not impacted (for example, they do not observe downtimes or data quality issues like duplication).

The following diagram illustrates the architecture of this solution.

Siemens built the solution with the following services and components:

  1. Scheduling trigger – New data (for example, in JSON format) is continuously uploaded to a S3 bucket.
  2. Task scheduling – As soon as new files land, an AWS Lambda function processes the resulting S3 bucket notification events. As part of the processing, it creates a new item on Amazon DynamoDB that specifies a Time to Live (TTL) and the path to that S3 object.
  3. Task execution trigger – When the TTL expires, the DynamoDB item is deleted from the table and the DynamoDB stream triggers a Lambda function that processes the S3 object at that path.
  4. Task execution – The Lambda function derives meta information (like the relevant S3 path) from the TTL expiration event and processes the S3 object. Finally, the new S3 object replaces the older version.
  5. Data usage – The updated data is available for querying from Athena without further manual processing, and uses S3’s eventual consistency on read operations.

About DynamoDB Streams and TTL

TTL for DynamoDB lets you define when items in a table expire so they can be deleted from the database automatically. TTL comes at no extra cost as a way to reduce storage use and reduce the cost of storing irrelevant data without using provisioned throughput. You can set a timestamp for deletion on a per-item basis, which allows you to limit storage usage to only those records that are relevant, by enabling TTL on a table.

Solution overview

To implement this solution manually, complete the following steps:

  1. Create a DynamoDB table and configure DynamoDB Streams.
  2. Create a Lambda function to insert TTL records.
  3. Configure an S3 event notification on the target bucket.
  4. Create a Lambda function that performs data processing tasks.
  5. Use Athena to query the processed data.

If you want to deploy the solution automatically, you may skip these steps, and use the AWS Cloudformation template provided.

Prerequisites

To complete this walkthrough, you must have the following:

  • An AWS account with access to the AWS Management Console.
  • A role with access to S3, DynamoDB, Lambda, and Athena.

Creating a DynamoDB table and configuring DynamoDB Streams

Start first with the time-based trigger setup. For this, you use S3 notifications, DynamoDB Streams, and a Lambda function to integrate both services. The DynamoDB table stores the items to process after a predefined time.

Complete the following steps:

  1. On the DynamoDB console, create a table.
  2. For Table name, enter objects-to-process.
  3. For Primary key, enter path and choose String.
  4. Select the table and click on Manage TTL next to “Time to live attribute” under table details.
  5. For TTL attribute, enter ttl.
  6. For DynamoDB Streams, choose Enable with view type New and old images.

Note that you can enable DynamoDB TTL on non-numeric attributes, but it only works on numeric attributes.

The DynamoDB TTL is not minute-precise. Expired items are typically deleted within 48 hours of expiration. However, you may experience shorter deviations of only 10–30 minutes from the actual TTL value. For more information, see Time to Live: How It Works.

Creating a Lambda function to insert TTL records

The first Lambda function you create is for scheduling tasks. It receives a S3 notification as input, recreates the S3 path (for example, s3:///), and creates a new item on DynamoDB with two attributes: the S3 path and the TTL (in seconds). For more information about a similar S3 notification event structure, see Test the Lambda Function.

To deploy the Lambda function, on the Lambda console, create a function named NotificationFunction with the Python 3.7 runtime and the following code:

import boto3, os, time

# Put here a new parameter for TTL, default 300, 5 minutes
default_ttl = 300

s3_client = boto3.client('s3')
table = boto3.resource('dynamodb').Table('objects-to-process')

def parse_bucket_and_key(s3_notif_event):
    s3_record = s3_notif_event['Records'][0]['s3']
    return s3_record['bucket']['name'], s3_record['object']['key']

def lambda_handler(event, context):
    try:
        bucket_name, key = parse_bucket_and_key(event)
        head_obj = s3_client.head_object(Bucket=bucket_name, Key=key)
        tags = s3_client.get_object_tagging(Bucket=bucket_name, Key=key)
        if(head_obj['ContentLength'] > 0 and len(tags['TagSet']) == 0):
            record_path = f"s3://{bucket_name}/{key}"
            table.put_item(Item={'path': record_path, 'ttl': int(time.time()) + default_ttl})
    except:
        pass # Ignore

Configuring S3 event notifications on the target bucket

You can take advantage of the scalability, security, and performance of S3 by using it as a data lake for storing your datasets. Additionally, you can use S3 event notifications to capture S3-related events, such as the creation or deletion of objects within a bucket. You can forward these events to other AWS services, such as Lambda.

To configure S3 event notifications, complete the following steps:

  1. On the S3 console, create an S3 bucket named data-bucket.
  2. Click on the bucket and go to “Properties” tab.
  3. Under Advanced Settings, choose Events and add a notification.
  4. For Name, enter MyEventNotification.
  5. For Events, select All object create events.
  6. For Prefix, enter dataset/.
  7. For Send to, choose Lambda Function.
  8. For Lambda, choose NotificationFunction.

This configuration restricts the scheduling to events that happen within your previously defined dataset. For more information, see How Do I Enable and Configure Event Notifications for an S3 Bucket?

Creating a Lambda function that performs data processing tasks

You have now created a time-based trigger for the deletion of the record in the DynamoDB table. However, when the system delete occurs and the change is recorded in DynamoDB Streams, no further action is taken. Lambda can poll the stream to detect these change records and trigger a function to process them according to the activity (INSERT, MODIFY, REMOVE).

This post is only concerned with deleted items because it uses the TTL feature of DynamoDB Streams to trigger task executions. Lambda gives you the flexibility to either process the item by itself or to forward the processing effort to somewhere else (such as an AWS Glue job or an Amazon SQS queue).

This post uses Lambda directly to process the S3 objects. The Lambda function performs the following tasks:

  1. Gets the S3 object from the DynamoDB item’s S3 path attribute.
  2. Modifies the object’s data.
  3. Overrides the old S3 object with the updated content and tags the object as processed.

Complete the following steps:

  1. On the Lambda console, create a function named JSONProcessingFunction with Python 3.7 as the runtime and the following code:
    import os, json, boto3
    from functools import partial
    from urllib.parse import urlparse
    
    s3 = boto3.resource('s3')
    
    def parse_bucket_and_key(s3_url_as_string):
        s3_path = urlparse(s3_url_as_string)
        return s3_path.netloc, s3_path.path[1:]
    
    def extract_s3path_from_dynamo_event(event):
        if event["Records"][0]["eventName"] == "REMOVE":
            return event["Records"][0]["dynamodb"]["Keys"]["path"]["S"]
    
    def modify_json(json_dict, column_name, value):
        json_dict[column_name] = value
        return json_dict
        
    def get_obj_contents(bucketname, key):
        obj = s3.Object(bucketname, key)
        return obj.get()['Body'].iter_lines()
    
    clean_column_2_func = partial(modify_json, column_name="file_contents", value="")
    
    def lambda_handler(event, context):
        s3_url_as_string = extract_s3path_from_dynamo_event(event)
        if s3_url_as_string:
            bucket_name, key = parse_bucket_and_key(s3_url_as_string)
            updated_json = "n".join(map(json.dumps, map(clean_column_2_func, map(json.loads, get_obj_contents(bucket_name, key)))))
            s3.Object(bucket_name, key).put(Body=updated_json, Tagging="PROCESSED=True")
        else:
            print(f"Invalid event: {str(event)}")
  2. On the Lambda function configuration webpage, click on Add trigger.
  3. For Trigger configuration, choose DynamoDB.
  4. For DynamoDB table, choose objects-to-process.
  5. For Batch size, enter 1.
  6. For Batch window, enter 0.
  7. For Starting position, choose Trim horizon.
  8. Select Enable trigger.

You use batch size = 1 because each S3 object represented on the DynamoDB table is typically large. If these files are small, you can use a larger batch size. The batch size is essentially the number of files that your Lambda function processes at a time.

Because any new objects on S3 (in a versioning-enabled bucket) create an object creation event, even if its key already exists, you must make sure that your task schedule Lambda function ignores any object creation events that your task execution function creates. Otherwise, it creates an infinite loop. This post uses tags on S3 objects: when the task execution function processes an object, it adds a processed tag. The task scheduling function ignores those objects in subsequent executions.

Using Athena to query the processed data

The final step is to create a table for Athena to query the data. You can do this manually or by using an AWS Glue crawler that infers the schema directly from the data and automatically creates the table for you. This post uses a crawler because it can handle schema changes and add new partitions automatically. To create this crawler, use the following code:

aws glue create-crawler --name data-crawler  
--role  
--database-name data_db 
--description 'crawl data bucket!' 
--targets 
"{
  "S3Targets": [
    {
      "Path": "s3:///dataset/"
    }
  ]
}"

Replace and with the name of your AWSGlueServiceRole and S3 bucket, respectively.

When the crawling process is complete, you can start querying the data. You can use the Athena console to interact with the table while its underlying data is being transparently updated. See the following code:

SELECT * FROM data_db.dataset LIMIT 1000

Automated setup

You can use the following AWS CloudFormation template to create the solution described on this post on your AWS account. To launch the template, choose the following link:

This CloudFormation stack requires the following parameters:

  • Stack name – A meaningful name for the stack, for example, data-updater-solution.
  • Bucket name – The name of the S3 bucket to use for the solution. The stack creation process creates this bucket.
  • Time to Live – The number of seconds to expire items on the DynamoDB table. Referenced S3 objects are processed on item expiration.

Stack creation takes up to a few minutes. Check and refresh the AWS CloudFormation Resources tab to monitor the process while it is running.

When the stack shows the state CREATE_COMPLETE, you can start using the solution.

Testing the solution

To test the solution, download the mock_uploaded_data.json dataset created with the Mockaroo data generator. The use case is a web service in which users can upload files. The goal is to delete those files some predefined time after the upload to reduce storage and query costs. To this end, the provided code looks for the attribute file_contents and replaces its value with an empty string.

You can now upload new data into your data-bucket S3 bucket under the dataset/ prefix. Your NotificationFunction Lambda function processes the resulting bucket notification event for the upload, and a new item appears on your DynamoDB table. Shortly after the predefined TTL time, the JSONProcessingFunction Lambda function processes the data and you can check the resulting changes via an Athena query.

You can also confirm that a S3 object was processed successfully if the DynamoDB item corresponding to this S3 object is no longer present in the DynamoDB table and the S3 object has the processed tag.

Conclusion

This post showed how to automatically re-process objects on S3 after a predefined amount of time by using a simple and fully managed scheduling mechanism. Because you use S3 for storage, you automatically benefit from S3’s eventual consistency model, simply by using identical keys (names) both for the original and processed objects. This way, you avoid query results with duplicate or missing data. Also, incomplete or only partially uploaded objects do not result in data inconsistencies because S3 only creates new object versions for successfully completed file transfers.

You may have previously used Spark to process objects hourly. This requires you to monitor objects that must be processed, to move and process them in a staging area, and to move them back to their actual destination. The main drawback is the final step because, due to Spark’s parallelism nature, files are generated with different names and contents. That prevents direct file replacement in the dataset and leads to downtimes or potential data duplicates when data is queried during a move operation. Additionally, because each copy/delete operation could potentially fail, you have to deal with possible partially processed data manually.

From an operations perspective, AWS serverless services simplify your infrastructure. You can combine the scalability of these services with a pay-as-you-go plan to start with a low-cost POC and scale to production quickly—all with a minimal code base.

Compared to hourly Spark jobs, you could potentially reduce costs by up to 80%, which makes this solution both cheaper and simpler.

Special thanks to Karl Fuchs, Stefan Schmidt, Carlos Rodrigues, João Neves, Eduardo Dixo and Marco Henriques for their valuable feedback on this post’s content.


About the Authors

Pedro Completo Bento is a senior big data engineer working at Siemens CDC. He holds a Master in Computer Science from the Instituto Superior Técnico in Lisbon. He started his career as a full-stack developer, specializing later on big data challenges. Working with AWS, he builds highly reliable, performant and scalable systems on the cloud, while keeping the costs at bay. In his free time, he enjoys to play boardgames with his friends.

Arturo Bayo is a big data consultant at Amazon Web Services. He promotes a data-driven culture in enterprise customers around EMEA, providing specialized guidance on business intelligence and data lake projects while working with AWS customers and partners to build innovative solutions around data and analytics.

We Are so Appreciative for the Show of Support!

$
0
0

Feed: All Oracle Press Releases.

NOTE: Before we turn to the more than 30 amicus briefs filed in support of Oracle at the Supreme Court, we are obligated to highlight the conduct of Google’s head of Global Affairs and Chief Legal Officer, Kent Walker. Over the past few months, Walker led a coercion campaign against companies and organizations that were likely to file on Oracle’s behalf to persuade them to stay silent.  We are aware of more than half a dozen contacts by Mr. Walker (or his representatives) to likely amici, but we probably only heard of a small piece of his efforts.

In our previous posts we detailed the facts in Google v. Oracle: Google copied verbatim 11,000 lines of Java code and then broke Java’s interoperability. We explained that Google knew fully that the Java code was subject to copyright but decided to copy it anyway and “make enemies along the way.”  We discussed IBM’s Jailbreak initiative, which was aborted because everyone understood—including Google and IBM—that Sun’s code was subject to a copyright license. 

We explained how there was never any confusion in the industry about how copyright was applied to software and no contemporaneous discussion whatsoever distinguishing between some code that’s copyrightable and other code that isn’t. All of this parsing of code was invented after the fact by Google. We discussed the impossibility of the Supreme Court drawing lines between some code and not other code (on a case-by-case basis), without undermining copyright protection for all computer programs, which is exactly Google’s intent. Lastly, we explained that Google’s business model is predicated on monetizing the content of others so its economic interests are correlated to weak intellectual property protection. And that is exactly why most members of the technology community declined to file briefs on Google’s behalf. 

More than 30 businesses, organizations, and individuals filed amicus briefs with the Supreme Court. The numerous amicus briefs filed on our behalf largely reflect actual owners of copyrights that have a direct stake in the outcome of this matter, and I wanted to highlight a few of them here. Most importantly, the totality of the briefs make an overwhelming case for the court to reject Google’s attempt to retroactively carve itself out of the law.

To start, the United States Solicitor General filed a brief in support of Oracle on behalf of the United States Government. The Solicitor General’s office will also participate in oral arguments before the Supreme Court, making clear that longstanding U.S. intellectual property policy is fundamentally at odds with Google’s position. It’s really hard to overstate how strong the Solicitor General’s brief is on Oracle’s behalf.  For example, the SG states “Contrary to [Google]’s contention, the Copyright Office has never endorsed the kind of copying in which [Google] engaged.” … “[Google] declined to take [the open source] or any other license, despite ‘lengthy licensing negotiations’ with [Oracle].  Instead, [Google] simply appropriated the material it wanted.” And, “[T]he fair use doctrine does not permit a new market entrant to copy valuable parts of an established work simply to attract fans to its own competing commercial product. To the contrary, copying ‘to get attention or to avoid the drudgery in working up something fresh’ actively disserves copyright’s goals.”

“[Google’s] approach [to copyrightability] is especially misguided because the particular post-creation changed circumstance on which it relies—i.e., developers’ acquired familiarity with the calls used to invoke various methods in the Java Standard Library—is a direct result of the Library’s marketplace success.” The SG continued, “Google designed its Android platform in a manner that made it incompatible with the Java platform. Pet. App. 46a n.11. Petitioner thus is not seeking to ensure that its new products are compatible with a ‘legacy product’ (Pet. Br. 26). Petitioner instead created a competing platform and copied thousands of lines of code from the Java Standard Library in order to attract software developers familiar with respondent’s work.”

And the SG stated, “The court of appeals correctly held that petitioner’s verbatim copying of respondent’s original computer code into a competing commercial product was not fair use.” Lastly, “the record contained  ‘overwhelming’  evidence that petitioner’s copying harmed the market for the Java platform.”

A brief by several songwriters and the Songwriters Guild explains that much like Oracle’s Java software, a large portion of music streams on YouTube are misappropriated for the good of Google and Google alone—“Through YouTube, Google profits directly from verbatim copies of Amici’s own works. These copies are unauthorized, unlicensed, and severely under-monetized.”

A brief filed by Recording Industry Association of America, National Music Publishers Association, and the American Association of Independent Music makes clear that its “members depend on an appropriately balanced fair use doctrine that furthers the purposes of copyright law, including the rights to control the reproduction and distribution of copyrighted works, to create derivative works, and to license the creation of derivative works.”

Briefs were filed expressing similar concerns from a broad spectrum of the creative community, including journalists, book publishers, photographers, authors, and the motion picture industry. Google’s attempts to retroactively justify a clear act of infringement with novel theories of software copyright and fair use have alarmed nearly every segment of the artistic and creative community.

Another amicus brief from the News Media Alliance (over 2,000 news media organizations), explains how Google Search, Google News and other online platforms appropriate vast quantities of its members’ journalistic output, and reproduces it to displace the original creative content. They point out that, as journalists, they often sit on both sides of the “fair use” defense, but warn that they “cannot stand silent when entire digital industries are built, and technology companies seek to achieve and maintain dominance, by the overly aggressive assertion of fair use as Google does in this case.”

And USTelecom, the national trade association representing the nation’s broadband industry, including technology providers, innovators, suppliers, and manufacturers. USTelecom notes that its members are poised to invest $350 billion in their software-driven networks over the next several years, laying the foundation for 5G. Software interfaces are also important for network providers to “enable interoperability among technologies, networks, and devices,” and “while telecommunications providers must share access to their software interfaces, they also must retain their exclusive property rights in their implementation of these interfaces if they are to ensure network security and resiliency, protect their customers’ privacy, innovate and compete.”

We were pleased that some of the most prominent names in technology—who were contemporaneous witnesses to Google’s theft—have filed amicus briefs in support Oracle’s position, including Scott McNealy, the longtime CEO of Sun Microsystems, and Joe Tucci, the longtime CEO of EMC Corporation. Mr. Tucci states, “as the numbers and ever-increasing success show, the system is working. Accepting Google’s invitation to upend that system by eliminating copyright protection for creative and original computer software code would not make the system better—it would instead have sweeping and harmful effects throughout the software industry.”

Several of our amici note in their briefs that the Constitution includes copyright protection in Article I, Section 8. As Consumers’ Research explains in their brief, “to the Founders, copyrights were not just a way to encourage innovation, but also to protect people’s inherent rights in the fruits of their labor. Any conception of copyright that ignores the latter is both incomplete and inconsistent with the original understanding of the Copyright Clause.”

One of the key points Oracle makes in our brief to the Court is the clear Congressional intent and action to provide full copyright protection to software, and the longstanding refusal by Congress to create any distinctions between different types of software code (such as “interfaces”).

Several of our amici reinforce this fact, none less authoritative than the former Senate and House Judiciary Chairmen. Former Senators Orrin Hatch and Dennis DeConcini, and former Congressman Bob Goodlatte make it clear that Google’s invitation to the Court to carve out some ill-defined category of “interfaces” from the Copyright Act’s full protection of all software code is contrary to the intent of Congress and plain language of the statute. According to the former Chairmen, “[B]oth the text and history of the Copyright Act show that Congress accorded computer programs full copyright protection, with no carve-out for some undefined subset of software.”

Furthermore, the former Members state, it would be beyond the purview of the Court to respond to Google and its amici’s policy arguments in favor of creating new standards of copyrightability and fair use for different, loosely defined categories of software. “This Court should not undermine [Congress’s] legislative judgment … by creating the loopholes to copyrightability and fair use that Google requests.”

The Members further point out, “to the extent that Google has a different, less-protective vision for the federal copyright regime, it is ‘free to seek action from Congress.’ (quoting the Solicitor General). Thus far, Congress has not seen fit to take such action, notwithstanding its recent comprehensive review of the federal copyright laws, which directly examined the scope of copyright protection and technological innovation. This Court should not diminish copyright protections for computer programs where Congress, as is its constitutional prerogative, has chosen to refrain from doing so for four decades.”

The Members’ points are given further emphasis by the extremely important brief from Professor Arthur Miller, who was a Presidential appointee to the National Commission on New Technological Uses of Copyrighted Works (“CONTU”), where he served on the Software Subcommittee. Professor Miller forcefully rebuts Google’s contention that the Java code it copied should be denied protection either because it was so popular or because it was in some category of un-protectable software it refers to as “interfaces.”

Congress had good reason not to enact a popularity exception to copyright. As an initial matter, such an exception would lure the courts into a hopeless exercise in line-drawing: Just how popular must a work become before the creator is penalized with loss of protection?… Nor does calling the copied material an “interface” aid in the line-drawing exercise. Though that term “may seem precise * * * it really has no specific meaning in programming. Certainly, it has no meaning that has any relevance to copyright principles.” (citing his seminal Harvard Law Review article on software copyright). “Any limitation on the protection of ‘interfaces’ thus would be a limitation on the protection of much of the valuable expression in programs, and would invite plagiarists to label as an ‘interface’ whatever they have chosen to copy without permission.” Ibid. More importantly, a popularity exception would eviscerate the goal of the Copyright Act, which is to promote advancements. “The purpose of copyright is to create incentives for creative effort.” Sony v. Universal City Studios. But advance too far and create widely desired work, petitioner warns, and risk losing copyright protection altogether; anyone will be able to copy the previously protected material by claiming that doing so was “necessary.” That logic is head-scratching. “[P]romoting the unauthorized copying of interfaces penalizes the creative effort of the original designer, something that runs directly counter to the core purposes of copyright law because it may freeze or substantially impede human innovation and technological growth.” (citing Miller Harvard Law Review article).

This history of strong copyright protection is further explained in the brief by the Committee for Justice: “The framers of the U.S. Constitution designed that document to protect the right to property. It was understood that strong property rights were fundamental to freedom and prosperity. The Constitution’s Copyright Clause is a critical part of this project. The clause empowers Congress to enact laws to protect intellectual property, which was understood to be worthy of protection in the same sense and to the same degree that tangible property is. Congress has taken up the task by enacting a series of Copyright Acts that have steadily expanded the protection afforded intellectual property. This, in turn, has led to a robust and thriving market for intellectual property.”

Likewise, the American Conservative Union Foundation, Internet Accountability Project, and American Legislative Exchange Council all recount the long history of copyright protections, going back to the Constitution, and the importance of maintaining a system of strong intellectual property rights. They also weigh-in against Google’s fair use defense. 

Similarly the Hudson Institute makes the point that if the Supreme Court were to adopt Google’s breathtakingly expansive view of fair use, it would “provide a roadmap to foreign actors like China to circumvent U.S. and international copyright protection for computer code and other works. Such a roadmap, if adopted by this Court, will remove the brighter lines and greater clarity provided by the decision below, and would eliminate a significant tool for private and governmental enforcement of IP rights.”

In separate briefs, two large software companies, Synopsys and SAS Institute, explain how the use of software code and “interfaces” actually work in the real world. Synopsis explains that the purpose of its brief is “to challenge the notion, offered by Google and its amici, that the copying of someone else’s code is a mainstay of the computer programming world. It is simply not true that ‘everybody does it,’ and that software piracy allows for lawful innovative entrepreneurship, as Google suggests.

SAS takes head-on the absurdity of Google’s professed interest in “interoperability” as the pretense for its unlicensed use of Oracle’s code. “Google copied the software interfaces not because it wanted Android applications to interoperate with Java, but so it could attract Java programmers for Android to replace Java. ‘Unrebutted evidence’ showed ‘that Google specifically designed Android to be incompatible with the Java platform and not allow for interoperability with Java programs.’ (citing Fed. Circuit decision). No case has found fair use where the defendant copied to produce an incompatible product.”

SAS also provides a powerful rebuttal to Google’s request for the Court to create new judicial carve-out from the Copyright Act for software “interfaces.” “There are unlimited ways to write interfaces, and nothing justifies removing them from what the Copyright Act expressly protects. To the contrary, the user-friendly expressive choices Sun made became critical to Java’s success. The thousands of lines of Java declaring code and the organization Google copied are intricate, creative expression. … The creativity is undeniable. ‘Google’s own ‘Java guru’ conceded that there can be ‘creativity and artistry even in a single method declaration.’” (citing Fed. Circuit decision) SAS goes on to provide detailed examples of the creative expression in declaring code.

I’ll conclude with the powerful brief of the former Register of Copyrights, Ralph Oman.  Mr. Oman forcefully rebuts the “sky is falling” rhetoric of Google and its amici regarding copyrights and software.

Copyright protection has spurred greater creativity, competition, and technological advancement, fueling an unprecedented period of intellectual growth and one of America’s greatest economic sectors today—software development. While Congress is of course free to revisit the application of copyright to software if it believes changes to the current regime are warranted, there is no basis for this Court to assume that policymaking role here. Instead, this Court should give effect to Congress’s intent, as embodied in the 1976 Act and its subsequent amendments, that traditional copyright principles apply to software just as these principles apply to other works. Applying those principles to the record in this case, the Federal Circuit properly concluded that Google’s conceded copying of the APIs infringed Oracle’s copyrights. While the technology at issue may be novel, the result that such free riding is not allowed is as old as copyright law itself.

We are grateful for this diverse, influential group of more than 30 amici, which we are certain will provide important, valuable insight to the Court in its deliberations.

We know that many of them have spoken up despite Google’s campaign of intimidation, which makes us even more appreciative.

Streaming ETL with Apache Flink and Amazon Kinesis Data Analytics

$
0
0

Feed: AWS Big Data Blog.

Most businesses generate data continuously in real time and at ever-increasing volumes. Data is generated as users play mobile games, load balancers log requests, customers shop on your website, and temperature changes on IoT sensors. You can capitalize on time-sensitive events, improve customer experiences, increase efficiency, and drive innovation by analyzing this data quickly. The speed at which you get these insights often depends on how quickly you can load data into data lakes, data stores, and other analytics tools. As data volume and velocity increases, it becomes more important to not only load the incoming data, but also to transform and analyze it in near-real time.

This post looks at how to use Apache Flink as a basis for sophisticated streaming extract-transform-load (ETL) pipelines. Apache Flink is a framework and distributed processing engine for processing data streams. AWS provides a fully managed service for Apache Flink through Amazon Kinesis Data Analytics, which enables you to build and run sophisticated streaming applications quickly, easily, and with low operational overhead.

This post discusses the concepts that are required to implement powerful and flexible streaming ETL pipelines with Apache Flink and Kinesis Data Analytics. It also looks at code examples for different sources and sinks. For more information, see the GitHub repo. The repo also contains an AWS CloudFormation template so you can get started in minutes and explore the example streaming ETL pipeline.

Architecture for streaming ETL with Apache Flink

Apache Flink is a framework and distributed processing engine for stateful computations over unbounded and bounded data streams. It supports a wide range of highly customizable connectors, including connectors for Apache Kafka, Amazon Kinesis Data Streams, Elasticsearch, and Amazon Simple Storage Service (Amazon S3). Moreover, Apache Flink provides a powerful API to transform, aggregate, and enrich events, and supports exactly-once semantics. Apache Flink is therefore a good foundation for the core of your streaming architecture.

To deploy and run the streaming ETL pipeline, the architecture relies on Kinesis Data Analytics. Kinesis Data Analytics enables you to run Flink applications in a fully managed environment. The service provisions and manages the required infrastructure, scales the Flink application in response to changing traffic patterns, and automatically recovers from infrastructure and application failures. You can combine the expressive Flink API for processing streaming data with the advantages of a managed service by using Kinesis Data Analytics to deploy and run Flink applications. It allows you to build robust streaming ETL pipelines and reduces the operational overhead of provisioning and operating infrastructure.

The architecture in this post takes advantage of several capabilities that you can achieve when you run Apache Flink with Kinesis Data Analytics. Specifically, the architecture supports the following:

  • Private network connectivity – Connect to resources in your Amazon Virtual Private Cloud (Amazon VPC), in your data center with a VPN connection, or in a remote region with a VPC peering connection
  • Multiple sources and sinks – Read and write data from Kinesis data streams, Apache Kafka clusters, and Amazon Managed Streaming for Apache Kafka (Amazon MSK) clusters
  • Data partitioning – Determine the partitioning of data that is ingested into Amazon S3 based on information extracted from the event payload
  • Multiple Elasticsearch indexes and custom document IDs – Fan out from a single input stream to different Elasticsearch indexes and explicitly control the document ID
  • Exactly-once semantics – Avoid duplicates when ingesting and delivering data between Apache Kafka, Amazon S3, and Amazon Elasticsearch Service (Amazon ES)

The following diagram illustrates this architecture.

The remainder of this post discusses how to implement streaming ETL architectures with Apache Flink and Kinesis Data Analytics. The architecture persists streaming data from one or multiple sources to different destinations and is extensible to your needs. This post does not cover additional filtering, enrichment, and aggregation transformations, although that is a natural extension for practical applications.

This post shows how to build, deploy, and operate the Flink application with Kinesis Data Analytics, without further focusing on these operational aspects. It is only relevant to know that you can create a Kinesis Data Analytics application by uploading the compiled Flink application jar file to Amazon S3 and specifying some additional configuration options with the service. You can then execute the Kinesis Data Analytics application in a fully managed environment. For more information, see Build and run streaming applications with Apache Flink and Amazon Kinesis Data Analytics for Java Applications and the Amazon Kinesis Data Analytics developer guide.

Exploring a streaming ETL pipeline in your AWS account

Before you consider the implementation details and operational aspects, you should get a first impression of the streaming ETL pipeline in action. To create the required resources, deploy the following AWS CloudFormation template:

The template creates a Kinesis data stream and an Amazon Elastic Compute Cloud (Amazon EC2) instance to replay a historic data set into the data stream. This post uses data based on the public dataset obtained from the New York City Taxi and Limousine Commission. Each event describes a taxi trip made in New York City and includes timestamps for the start and end of a trip, information on the boroughs the trip started and ended in, and various details on the fare of the trip. A Kinesis Data Analytics application then reads the events and persists them to Amazon S3 in Parquet format and partitioned by event time.

Connect to the instance by following the link next to ConnectToInstance in the output section of the CloudFromation template that you executed previously. You can then start replaying a set of taxi trips into the data stream with the following code:

$ java -jar /tmp/amazon-kinesis-replay-*.jar -noWatermark -objectPrefix artifacts/kinesis-analytics-taxi-consumer/taxi-trips-partitioned.json.lz4/dropoff_year=2018/ -speedup 3600 -streamName 

You can obtain this command with the correct parameters from the output section of the AWS CloudFormation template. The output section also points you to the S3 bucket to which events are persisted and an Amazon CloudWatch dashboard that lets you monitor the pipeline.

For more information about enabling the remaining combinations of sources and sinks, for example, Apache Kafka and Elasticsearch, see the GitHub repo.

Building a streaming ETL pipeline with Apache Flink

Now that you have seen the pipeline in action, you can dive into the technical aspects of how to implement the functionality with Apache Flink and Kinesis Data Analytics.

Reading and writing to private resources

Kinesis Data Analytics applications can access resources on the public internet and resources in a private subnet that is part of your VPC. By default, a Kinesis Data Analytics application only enables access to resources that you can reach over the public internet. This works well for resources that provide a public endpoint, for example, Kinesis data streams or Amazon Elasticsearch Service.

If your resources are private to your VPC, either for technical or security-related reasons, you can configure VPC connectivity for your Kinesis Data Analytics application. For example, MSK clusters are private; you cannot access them from the public internet. You may run your own Apache Kafka cluster on premises that is not exposed to the public internet and is only accessible from your VPC through a VPN connection. The same is true for other resources that are private to your VPC, such as relational databases or AWS PrivateLink-powered endpoints.

To enable VPC connectivity, configure the Kinesis Data Analytics application to connect to private subnets in your VPC. Kinesis Data Analytics creates elastic network interfaces in one or more of the subnets provided in your VPC configuration for the application, depending on the parallelism of the application. For more information, see Configuring Kinesis Data Analytics for Java Applications to access Resources in an Amazon VPC.

The following screenshot shows an example configuration of a Kinesis Data Analytics application with VPC connectivity:

The application can then access resources that have network connectivity from the configured subnets. This includes resources that are not directly contained in these subnets, which you can reach over a VPN connection or through VPC peering. This configuration also supports endpoints that are available over the public internet if you have a NAT gateway configured for the respective subnets. For more information, see Internet and Service Access for a VPC-Connected Kinesis Data Analytics for Java application.

Configuring Kinesis and Kafka sources

Apache Flink supports various data sources, including Kinesis Data Streams and Apache Kafka. For more information, see Streaming Connectors on the Apache Flink website.

To connect to a Kinesis data stream, first configure the Region and a credentials provider. As a general best practice, choose AUTO as the credentials provider. The application will then use temporary credentials from the role of the respective Kinesis Data Analytics application to read events from the specified data stream. This avoids baking static credentials into the application. In this context, it is also reasonable to increase the time between two read operations from the data stream. When you increase the default of 200 milliseconds to 1 second, the latency increases slightly, but it facilitates multiple consumers reading from the same data stream. See the following code:

Properties properties = new Properties();
properties.setProperty(AWSConfigConstants.AWS_REGION, "<Region name>");
properties.setProperty(AWSConfigConstants.AWS_CREDENTIALS_PROVIDER, "AUTO");
properties.setProperty(ConsumerConfigConstants.SHARD_GETRECORDS_INTERVAL_MILLIS, "1000");

This config is passed to the FlinkKinesisConsumer with the stream name and a DeserializationSchema. This post uses the TripEventSchema for deserialization, which specifies how to deserialize a byte array that represents a Kinesis record into a TripEvent object. See the following code:

StreamExecutionEnvironment env = StreamExecutionEnvironment.getExecutionEnvironment();

DataStream events = env.addSource(
  new FlinkKinesisConsumer<>("<Kinesis stream name>", new TripEventSchema(), properties)
);

For more information, see TripEventSchema.java and TripEvent.java on GitHub. Apache Flink provides other more generic serializers that can deserialize data into strings or JSON objects.

Apache Flink is not limited to reading from Kinesis data streams. If you configure the Kinesis Data Analytics application’s VPC settings correctly, Apache Flink can also read events from Apache Kafka and MSK clusters. Specify a comma-separated list of broker and port pairs to use for the initial connection to your cluster. This config is passed to the FlinkKafkaConsumer with the topic name and a DeserializationSchema to create a source that reads from the respective topic of the Apache Kafka cluster. See the following code:

Properties properties = new Properties();
properties.setProperty("bootstrap.servers", "");

DataStream events = env.addSource(
  new FlinkKafkaConsumer<>("", new TripEventSchema(), properties)
);

The resulting DataStream contains TripEvent objects that have been deserialized from the data ingested into the data stream and Kafka topic, respectively. You can then use the data streams in combination with a sink to persist the events into their respective destination.

Persisting data in Amazon S3 with data partitioning

When you persist streaming data to Amazon S3, you may want to partition the data. You can substantially improve query performance of analytic tools by partitioning data because partitions that cannot contribute to a query can be pruned and therefore do not need to be read. For example, the right partitioning strategy can improve Amazon Athena query performance and cost by reducing the amount of data read for a query. You should choose to partition your data by the same attributes used in your application logic and query patterns. Furthermore, it is common when processing streaming data to include the time of an event, or event time, in your partitioning strategy. This contrasts with using the ingestion time or some other service-side timestamp that does not reflect the time an event occurred as accurately as event time.

For more information about taking data partitioned by ingestion time and repartitioning it by event time with Athena, see Analyze your Amazon CloudFront access logs at scale. However, you can directly partition the incoming data based on event time with Apache Flink by using the payload of events to determine the partitioning, which avoids an additional post-processing step. This capability is called data partitioning and is not limited to partition by time.

You can realize data partitioning with Apache Flink’s StreamingFileSink and BucketAssigner. For more information, see Streaming File Sink on the Apache Flink website.

When given a specific event, the BucketAssigner determines the corresponding partition prefix in the form of a string. See the following code:

public class TripEventBucketAssigner implements BucketAssigner {
  public String getBucketId(TripEvent event, Context context) {
    return String.format("pickup_location=%03d/year=%04d/month=%02d",
        event.getPickupLocationId(),
        event.getPickupDatetime().getYear(),
        event.getPickupDatetime().getMonthOfYear()
    );
  }

  ...
}

The sink takes an argument for the S3 bucket as a destination path and a function that converts the TripEvent Java objects into a string. See the following code:

SinkFunction sink = StreamingFileSink
  .forRowFormat(
    new Path("s3://"),
    (Encoder) (element, outputStream) -> {
      PrintStream out = new PrintStream(outputStream);
      out.println(TripEventSchema.toJson(element));
    }
  )
  .withBucketAssigner(new TripEventBucketAssigner())
  .withRollingPolicy(DefaultRollingPolicy.create().build())
  .build();

events.keyBy(TripEvent::getPickupLocationId).addSink(sink);

You can further customize the size of the objects you write to Amazon S3 and the frequency of the object creation with a rolling policy. You can configure your policy to have more events aggregated into fewer objects at the cost of increased latency, or vice versa. This can help avoid many small objects on Amazon S3, which can be a desirable trade-off for increased latency. A high number of objects can negatively impact the query performance of consumers reading the data from Amazon S3. For more information, see DefaultRollingPolicy on the Apache Flink website.

The number of output files that arrive in your S3 bucket per your rolling policy also depends on the parallelism of the StreamingFileSink and how you distribute events between Flink application operators. In the previous example, the Flink internal DataStream is partitioned by pickup location ID with the keyBy operator. The location ID is also used in the BucketAssigner as part of the prefix for objects that are written to Amazon S3. Therefore, the same node aggregates and persists all events with the same prefix, which results in particularly large objects on Amazon S3.

Apache Flink uses multipart uploads under the hood when writing to Amazon S3 with the StreamingFileSink. In case of failures, Apache Flink may not be able to clean up incomplete multipart uploads. To avoid unnecessary storage fees, set up the automatic cleanup of incomplete multipart uploads by configuring appropriate lifecycle rules on the S3 bucket. For more information, see Important Considerations for S3 on the Apache Flink website and Example 8: Lifecycle Configuration to Abort Multipart Uploads.

Converting output to Apache Parquet

In addition to partitioning data before delivery to Amazon S3, you may want to compress it with a columnar storage format. Apache Parquet is a popular columnar format, which is well supported in the AWS ecosystem. It reduces the storage footprint and can substantially increase query performance and reduce cost.

The StreamingFileSink supports Apache Parquet and other bulk-encoded formats through a built-in BulkWriter factory. See the following code:

SinkFunction sink = StreamingFileSink
  .forBulkFormat(
    new Path("s3://"),
    ParquetAvroWriters.forSpecificRecord(TripEvent.class)
  )
  .withBucketAssigner(new TripEventBucketAssigner())
  .build();

events.keyBy(TripEvent::getPickupLocationId).addSink(sink);

For more information, see Bulk-encoded Formats on the Apache Flink website.

Persisting events works a bit differently when you use the Parquet conversion. When you enable Parquet conversion, you can only configure the StreamingFileSink with the OnCheckpointRollingPolicy, which commits completed part files to Amazon S3 only when a checkpoint is triggered. You need to enable Apache Flink checkpoints in your Kinesis Data Analytics application to persist data to Amazon S3. It only becomes visible for consumers when a checkpoint is triggered, so your delivery latency depends on how often your application is checkpointing.

Moreover, you previously just needed to generate a string representation of the data to write to Amazon S3. In contrast, the ParquetAvroWriters expects an Apache Avro schema for events. For more information, see the GitHub repo. You can use and extend the schema on the repo if you are want an example.

In general, it is highly desirable to convert data into Parquet if you want to work with and query the persisted data effectively. Although it requires some additional effort, the benefits of the conversion outweigh these additional complexities compared to storing raw data.

Fanning out to multiple Elasticsearch indexes and custom document IDs

Amazon ES is a fully managed service that makes it easy for you to deploy, secure, and run Elasticsearch clusters. A popular use case is to stream application and network log data into Amazon S3. These logs are documents in Elasticsearch parlance, and you can create one for every event and store it in an Elasticsearch index.

The Elasticsearch sink that Apache Flink provides is flexible and extensible. You can specify an index based on the payload of each event. This is useful when the stream contains different event types and you want to store the respective documents in different Elasticsearch indexes. With this capability, you can use a single sink and application, respectively, to write into multiple indexes. With newer Elasticsearch versions, a single index cannot contain multiple types. See the following code:

SinkFunction sink = AmazonElasticsearchSink.buildElasticsearchSink(
  "",
  "",
  new ElasticsearchSinkFunction() {
   public IndexRequest createIndexRequest(TripEvent element) {
    String type = element.getType().toString();
    String tripId = Long.toString(element.getTripId());

    return Requests.indexRequest()
      .index(type)
      .type(type)
      .id(tripId)
      .source(TripEventSchema.toJson(element), XContentType.JSON);
   }
);

events.addSink(sink);

You can also explicitly set the document ID when you send documents to Elasticsearch. If an event with the same ID is ingested into Elasticsearch multiple times, it is overwritten rather than creating duplicates. This enables your writes to Elasticsearch to be idempotent. In this way, you can obtain exactly-once semantics of the entire architecture, even if your data sources only provide at-least-once semantics.

The AmazonElasticsearchSink used above is an extension of the Elasticsearch sink that is comes with Apache Flink. The sink adds support to sign requests with IAM credentials so you can use the strong IAM-based authentication and authorization that is available from the service. To this end, the sink picks up temporary credentials from the Kinesis Data Analytics environment in which the application is running. It uses the Signature Version 4 method to add authentication information to the request that is sent to the Elasticsearch endpoint.

Leveraging exactly-once semantics

You can obtain exactly-once semantics by combining an idempotent sink with at-least-once semantics, but that is not always feasible. For instance, if you want to replicate data from one Apache Kafka cluster to another or persist transactional CDC data from Apache Kafka to Amazon S3, you may not be able to tolerate duplicates in the destination, but both of these sinks are not idempotent.

Apache Flink natively supports exactly-once semantics. Kinesis Data Analytics implicitly enables exactly-once mode for checkpoints. To obtain end-to-end exactly-once semantics, you need to enable checkpoints for the Kinesis Data Analytics application and choose a connector that supports exactly-once semantics, such as the StreamingFileSink. For more information, see Fault Tolerance Guarantees of Data Sources and Sinks on the Apache Flink website.

There are some side effects to using exactly-once semantics. For example, end-to-end latency increases for several reasons. First, you can only commit the output when a checkpoint is triggered. This is the same as the latency increases that occurred when you turned on Parquet conversion. The default checkpoint interval is 1 minute, which you can decrease. However, obtaining sub-second delivery latencies are difficult with this approach.

Also, the details of end-to-end exactly-once semantics are subtle. Although the Flink application may read in an exactly-once fashion from a data stream, duplicates may already be part of the stream, so you can only obtain at-least-once semantics of the entire application. For Apache Kafka as a source and sink, different caveats apply. For more information, see Caveats on the Apache Flink website.

Be sure that you understand all the details of the entire application stack before you take a hard dependency on exactly-once semantics. In general, if your application can tolerate at-least-once semantics, it’s a good idea to use that semantic instead of relying on stronger semantics that you don’t need.

Using multiple sources and sinks

One Flink application can read data from multiple sources and persist data to multiple destinations. This is interesting for several reasons. First, you can persist the data or different subsets of the data to different destinations. For example, you can use the same application to replicate all events from your on-premises Apache Kafka cluster to an MSK cluster. At the same time, you can deliver specific, valuable events to an Elasticsearch cluster.

Second, you can use multiple sinks to increase the robustness of your application. For example, your application that applies filters and enriches streaming data can also archive the raw data stream. If something goes wrong with your more complex application logics, Amazon S3 still has the raw data, which you can use to backfill the sink.

However, there are some trade-offs. When you bundle many functionalities in a single application, you increase the blast radius of failures. If a single component of the application fails, the entire application fails and you need to recover it from the last checkpoint. This causes some downtime and increased delivery latency to all delivery destinations in the application. Also, a single large application is often harder to maintain and to change. You should strike a balance between adding functionality or creating additional Kinesis Data Analytics applications.

Operational aspects

When you run the architecture in production, you set out to execute a single Flink application continuously and indefinitely. It is crucial to implement monitoring and proper alarming to make sure that the pipeline is working as expected and the processing can keep up with the incoming data. Ideally, the pipeline should adapt to changing throughput conditions and cause notifications if it fails to deliver data from the sources to the destinations.

Some aspects require specific attention from an operational perspective. The following section provides some ideas and further references on how you can increase the robustness of your streaming ETL pipelines.

Monitoring and scaling sources

The data stream and the MSK cluster, respectively, are the entry point to the entire architecture. They decouple the data producers from the rest of the architecture. To avoid any impact to data producers, which you often cannot control directly, you need to scale the input stream of the architecture appropriately and make sure that it can ingest messages at any time.

Kinesis Data Streams uses a throughput provisioning model based on shards. Each shard provides a certain read and write capacity. From the number of provisioned shards, you can derive the maximum throughput of the stream in terms of ingested and emitted events and data volume per second. For more information, see Kinesis Data Streams Quotas.

Kinesis Data Streams exposes metrics through CloudWatch that report on these characteristics and indicate whether the stream is over- or under-provisioned. You can use the IncomingBytes and IncomingRecords metrics to scale the stream proactively, or you can use the WriteProvisionedThroughputExceeded metrics to scale the stream reactively. Similar metrics exist for data egress, which you should also monitor. For more information, see Monitoring the Amazon Kinesis Data Streams with Amazon CloudWatch.

The following graph shows some of these metrics for the data stream of the example architecture. On average the Kinesis data stream receives 2.8 million events and 1.1 GB of data every minute.

You can use the IncomingBytes and IncomingRecords metrics to scale the stream proactively whereas you can use the WriteProvisionedThroughputExceeded metrics to scale the stream reactively. You can even automate the scaling of your Kinesis Data Streams. For more information, see Scale Your Amazon Kinesis Stream Capacity with UpdateShardCount.

Apache Kafka and Amazon MSK use a node-based provisioning model. Amazon MSK also exposes metrics through CloudWatch, including metrics that indicate how much data and how many events are ingested into the cluster. For more information, see Amazon MSK Metrics for Monitoring with CloudWatch.

In addition, you can also enable open monitoring with Prometheus for MSK clusters. It is a bit harder to know the total capacity of the cluster, and you often need benchmarking to know when you should scale. For more information about important metrics to monitor, see Monitoring Kafka on the Confluent website.

Monitoring and scaling the Kinesis Data Analytics application

The Flink application is the central core of the architecture. Kinesis Data Analytics executes it in a managed environment, and you want to make sure that it continuously reads data from the sources and persists data in the data sinks without falling behind or getting stuck.

When the application falls behind, it often is an indicator that it is not scaled appropriately. Two important metrics to track the progress of the application are millisBehindLastest (when the application is reading from a Kinesis data stream) and records-lag-max (when it is reading from Apache Kafka and Amazon MSK). These metrics not only indicate that data is read from the sources, but they also tell if data is read fast enough. If the values of these metrics are continuously growing, the application is continuously falling behind, which may indicate that you need to scale up the Kinesis Data Analytics application. For more information, see Kinesis Data Streams Connector Metrics and Application Metrics.

The following graph shows the metrics for the example application in this post. During checkpointing, the maximum millisBehindLatest metric occasionally spikes up to 7 seconds. However, because the reported average of the metric is less than 1 second and the application immediately catches up to the tip of the stream again, it is not a concern for this architecture.

Although the lag of the application is one of the most important metrics to monitor, there are other relevant metrics that Apache Flink and Kinesis Data Analytics expose. For more information, see Monitoring Apache Flink Applications 101 on the Apache Flink website.

Monitoring sinks

To verify that sinks are receiving data and, depending on the sink type, do not run out of storage, you need to monitor sinks closely.

You can enable detailed metrics for your S3 buckets that track the number of requests and data uploaded into the bucket with 1-minute granularity. For more information, see Monitoring Metrics with Amazon CloudWatch. The following graph shows these metrics for the S3 bucket of the example architecture:

When the architecture persists data into a Kinesis data stream or a Kafka topic, it acts as a producer, so the same recommendations as for monitoring and scaling sources apply. For more information about operating and monitoring the service in production environments, see Amazon Elasticsearch Service Best Practices.

Handling errors

“Failures are a given and everything eventually fails over time”, so you should expect the application to fail at some point. For example, an underlying node of the infrastructure that Kinesis Data Analytics manages might fail, or intermittent timeouts on the network can prevent the application from reading from sources or writing to sinks. When this happens, Kinesis Data Analytics restarts the application and resumes processing by recovering from the latest checkpoint. Because the raw events have been persisted in a data stream or Kafka topic, the application can reread the events that have been persisted in the stream between the last checkpoint and when it recovered and continue standard processing.

These kinds of failures are rare and the application can gracefully recover without sacrificing processing semantics, including exactly-once semantics. However, other failure modes need additional attention and mitigation.

When an exception is thrown anywhere in the application code, for example, in the component that contains the logic for parsing events, the entire application crashes. As before, the application eventually recovers, but if the exception is from a bug in your code that a specific event always hits, it results in an infinite loop. After recovering from the failure, the application rereads the event, because it was not processed successfully before, and crashes again. The process starts again and repeats indefinitely, which effectively blocks the application from making any progress.

Therefore, you want to catch and handle exceptions in the application code to avoid crashing the application. If there is a persistent problem that you cannot resolve programmatically, you can use side outputs to redirect the problematic raw events to a secondary data stream, which you can persist to a dead letter queue or an S3 bucket for later inspection. For more information, see Side Outputs on the Apache Flink website.

When the application is stuck and cannot make any progress, it is at least visible in the metrics for application lag. If your streaming ETL pipeline filters or enriches events, failures may be much more subtle, and you may only notice them long after they have been ingested. For instance, due to a bug in the application, you may accidentally drop important events or corrupt their payload in unintended ways. Kinesis data streams stores events for up to 7 days and, though technically possible, Apache Kafka is often not configured to store events indefinitely either. If you don’t identify the corruption quickly enough, you risk losing information when the retention of the raw events expires.

To protect against this scenario, you can persist the raw events to Amazon S3 before you apply any additional transformations or processing to them. You can keep the raw events and reprocess or replay them into the stream if you need to. To integrate the functionality into the application, add a second sink that just writes to Amazon S3. Alternatively, use a separate application that only reads and persists the raw events from the stream, at the cost of running and paying for an additional application.

When to choose what

AWS provides many services that work with streaming data and can perform streaming ETL. Amazon Kinesis Data Firehose can ingest, process, and persist streaming data into a range of supported destinations. There is a significant overlap of the functionality between Kinesis Data Firehose and the solution in this post, but there are different reasons to use one or the other.

As a rule of thumb, use Kinesis Data Firehose whenever it fits your requirements. The service is built with simplicity and ease of use in mind. To use Kinesis Data Firehose, you just need to configure the service. You can use Kinesis Data Firehose for streaming ETL use cases with no code, no servers, and no ongoing administration. Moreover, Kinesis Data Firehose comes with many built-in capabilities, and its pricing model allows you to only pay for the data processed and delivered. If you don’t ingest data into Kinesis Data Firehose, you pay nothing for the service.

In contrast, the solution in this post requires you to create, build, and deploy a Flink application. Moreover, you need to think about monitoring and how to obtain a robust architecture that is not only tolerant against infrastructure failures but also resilient against application failures and bugs. However, this added complexity unlocks many advanced capabilities, which your use case may require. For more information, see Build and run streaming applications with Apache Flink and Amazon Kinesis Data Analytics for Java Applications and the Amazon Kinesis Data Analytics Developer Guide.

What’s next?

This post discussed how to build a streaming ETL pipeline with Apache Flink and Kinesis Data Analytics. It focused on how to build an extensible solution that addresses some advanced use cases for streaming ingest while maintaining low operational overhead. The solution allows you to quickly enrich, transform, and load your streaming data into your data lake, data store, or another analytical tool without the need for an additional ETL step. The post also explored ways to extend the application with monitoring and error handling.

You should now have a good understanding of how to build streaming ETL pipelines on AWS. You can start capitalizing on your time-sensitive events by using a streaming ETL pipeline that makes valuable information quickly accessible to consumers. You can tailor the format and shape of this information to your use case without adding the substantial latency of traditional batch-based ETL processes.


About the Author

Steffen Hausmann is a Specialist Solutions Architect for Analytics at AWS. He works with customers around the globe to design and build streaming architectures so that they can get value from analyzing their streaming data. He holds a doctorate degree in computer science from the University of Munich and in his free time, he tries to lure his daughters into tech with cute stickers he collects at conferences. You can follow his ruthless attempts on Twitter (@sthmmm).


rOpenSci’s Leadership in #rstats Culture

$
0
0

Feed: R-bloggers.
Author: rOpenSci – open tools for open science.

At their closing keynote at the 2020 RStudio Conference, Hilary Parker and Roger Peng mentioned that they hatched the idea for their excellent Not So Standard Deviations podcast following their reunion at the 2015 rOpenSci unconf, (“runconf15”). That statement went straight to my heart because it pin-pointed how I had been feeling throughout the week of RStudio Conference that I had been unable to name. At rstudio::conf, I was surrounded by so many of the incredible people I had met at that very same runconf15. These folks are visionaries and leaders, founding and leading global efforts in open source software and inclusive culture, and the fact that they were all together at a small event convened by rOpenSci holds great significance. I am so honored to know this community, and to consider them allies and friends. The RStudio Conference (“rstudio::conf”), a conference with 2400 people, felt cozy with their presence and with the visible efforts they have led to make R and beyond a welcoming, innovative space. In a follow-up to an earlier blog summary of rstudio::conf(2020), here I want to reflect on how important runconf15 was, and how truly unique and gamechanging rOpenSci is.


The 2020 RStudio Conference felt monumentous to me personally because it marked five years of me being in the #rstats community (which I define broadly to be the deliberate, inclusive, and welcoming culture around R and that visibly exists on the Twitter #rstats hashtag) . #rstats has not only upgraded my analytical practices, but it has also changed the trajectory of my career and life: it has upgraded my skillset and also my mindset and expectations of what is possible for scientific research and beyond. I mentioned this in my 2019 useR! keynote, but I intentionally did not really talk about it. What I could not say in that keynote was describe really at all how important rOpenSci — the program, leadership, and community — is to me because I can’t talk about it without my voice wavering with emotion. But here, written, I will try.

My entryway to #rstats all started with a single person who welcomed me: Karthik Ram.

Karthik is a data scientist, an ecologist, and a world-changer. He not only co-founded, built up, and leads rOpenSci, but also leads efforts at the Berkeley Institute for Data Science and the US Research Software Sustainability Institute, among a million other things. He is an incredibly warm, thoughtful person, and he first said hello to me when he was co-teaching the Open Science for Synthesis course at NCEAS where I am based (but was not attending). I met him in the hallway one day and he asked me about my work and told me a bit about rOpenSci.

rOpenSci brings software developers and users together to innovate on creating new coding tools and promoting open science. It does this by deliberately creating a friendly, positive environment where folks with different backgrounds and expertise feel welcome and comfortable to learn, share ideas and innovate together. rOpenSci exists primarily online, through its extensive staff- and community-developed and ever-growing ecosystem of R packages, Community Calls, discussion forum, Twitter and Slack. It also catalyzes relationships and strengthens community through in-person “unconf” events, bringing community members physically together to collaborate on specific projects of their choice.


The 2015 rOpenSci unconf (“runconf15”) was transformative for someone like me, so new to coding. Beforehand, I was pretty scarred by my experience coding, and really thought that software was a static, untouchable, and unalterable thing, sort of like a refrigerator that did Its Purpose and Too Bad if it doesn’t work quite right or limits your imagination of could be possible. Honestly, my closest inkling that I could interact with software or software developers was through Clippy.

But at runconf15, I learned not only that software developers were real people, they were kind people. They were kind people who would take time to talk to a new user/marine ecologist like me, and be interested in my use cases, questions, needs, and learning process. My colleague Jamie and I were able to talk with RStudio’s Joe Cheng about our pitfalls and limitations of working with raster map data in R. And then we were blown away as Joe began coding a package to make rasters faster right before our eyes, in dialogue with us as we sat together.


Having these kind people (note: “kind people” not “kind of people”) all together ready to innovate does not happen by accident. It takes deliberate intent and attention to bringing us together and setting the tone in a comfortable space to interact. And this was the vision of rOpenSci. This runconf15 was the first time I heard a Code of Conduct. And it was the first time I had experienced a large setting without hierarchy, and felt like I belonged and could contribute in a way that was welcomed.

I’ve been thinking back to rOpenSci’s runconf15 event five years ago. My interests, time investment, and career focus on kinder science was definitely catalyzed by runconf15, and then reinforced by other’s efforts from this very same event. Those runconf15 participants who were already #rstats influencers…were they catalyzed as well? Hilary Parker and Roger Peng said that their NSSD podcast idea came out of rOpenSci’s event. How about Tracy Teal, who became executive director of The Carpentries, Gabriela de Queiroz who had created and then turned RLadies into a global movement, Arfon Smith, who went on to lead the Journal of Open Source Software, and RStudio, who increased their team and customer base by an order of magnitude in five years and who launched rstudio::conf in 2017?

rOpenSci made concerted efforts to continue building and nurturing this community after runconf15. This means leveraging the power of the internet, where conversations ignited at runconf15 was continued with enthusiasm and innovation.


But rOpenSci is all about welcoming more and more people into the rOpenSci and #rstats community, as is evident in part from runconf16, runconf17, and runconf18, and the 28.2K Twitter followers (as of February 2020). rOpenSci has created a friendly watershed of innovation, with a growing network of diverse people and skillsets contributing in myriad ways, like streams joining a ever-stronger flowing river.

And what I am trying to do with Openscapes is to connect additional tributaries to this rOpenSci watershed. I think that the most important thing I do here with Openscapes is to pass forward what I’ve learned from rOpenSci leadership and community, and welcome additional scientists to join. When we talk about the awesomeness of R communities in our mentor sessions, it’s not only to encourage them to become a part of them, but also to extend its ethos and kick-start kinder science around them.

Thank you rOpenSci leadership and the greater community for being so welcoming and supportive of me and everyone like me.


If you got this far, why not subscribe for updates from the site? Choose your flavor: e-mail, twitter, RSS, or facebook

Real-Time Streaming – Actionable Insights Drive Business Responsiveness

$
0
0

Feed: Actian.
Author: Pradeep Bhanot.

If you want your business to be agile, you need to be leveraging real-time data.  The environments that your businesses operate in are changing faster than ever – new competition in the marketplace, regulatory changes; operational issues; and new technology advancements are only the tip of the iceberg.  If you want to survive and thrive in the fast-paced business environment, you need to be agile.

To be agile, you need to understand what is going on in your environment, make quick and informed decisions, and then rapidly respond to exploit opportunities and mitigate risks.  Every moment of delay is lost opportunity.  If you can learn to manage streaming actionable insights effectively, you will be able to expand your company’s capabilities for real-time responsiveness and by doing so, achieve the grand ambition of business agility.

Data blind-spots lead to bad decisions.

The first step in achieving business agility is to collect the right amount and types of data about what is going on in your environment.  Recent technology trends, such as IoT, embedded sensors, data subscriptions, and mobile apps, have greatly expanded your data collection options.  These new data collection technologies enable you to monitor what is going on both inside your operations as well as in the broader business environment in real-time. They produce continuous streams of data that serve as your eyes and ears to understand what is happening and, more importantly, what is changing.

If you aren’t collecting enough data, the result is blind spots.  It is like driving a car; if you only look out the front window, you have a limited view of what is going on around you.  Mirrors, cameras, sensors, and the habit of looking around give you a broader perspective that reduces blind spots.

It’s the unknown unknowns that cause companies to fail.  If you don’t recognize your blind spots, you will naively make decisions that you think are informed by data but are nothing more than assumptions and guesses.  That can lead to disastrous consequences. The good news is current capabilities give you the ability to eliminate most of your blind spots and give you the insights needed to develop a holistic view of your business environment.

Converting raw data into actionable insights

Collecting raw data isn’t enough; you need a way to manage it and transform it into actionable insights.   Streaming data is great; it provides you broad visibility into what is going on across your business.  But if you don’t have the right tools and processes to manage streaming data, you will quickly be overwhelmed.

The meaningful signals in the data get drowned out by the noise, and before long, decision-makers stop using the data entirely.  This is what happens when big data isn’t managed – it becomes clutter.  To avoid this, you need a data management process for turning streaming data into actionable insights about your operations.

Converting streaming data into actionable insights is a process of incremental refinement – a value chain.  Inputs are collected from many different data sources – there are the new technologies mentioned above, and there are also things like transactional workflows, event logs, social media feeds, and website interactions.

The first step in refinement is to connect to all these data sources and aggregate the data streams in a common place where they can be further processed.  Because the data sources you need are so diverse, many companies are leveraging an integration platform as a service (IPaaS) to help them do this.

Once aggregated, the data must be integrated and organized to understand how the different streams relate to each other. This typically happens in an operational data warehouse.  Modern cloud data warehouses are designed for high-performance, massively scalable data processing that is ideal for working with streaming data.

After the streaming data is organized, it can then be analyzed to separate the meaningful signals from the noise.  These signals may be indicators of something deviating from what is expected or a change occurring in the environment.  The signals are analyzed in the context of your operations, systems, and business processes to assess their relevance and importance. Applying this information is how you build actionable insights.

Once an actionable insight has been identified, it then needs to be converted to action. It does no good to identify an issue or opportunity if you aren’t going to act on it.  Real-time responsiveness is achieved by getting actionable insights into the hands of the decision-makers who can use them to drive change and action within the organization.

This may be strategic decision-makers in management or equipment operators who can implement tactical changes.  Analytics and reporting tools, real-time operational dashboards, and alerts (texts, alarms, email, and audible messages) are universal tools for letting decision-makers know there is an actionable insight requiring their attention.

The cost of delay

Business agility comes from real-time responsiveness.  You can’t respond in real-time if there is a delay in learning about the problem or opportunity.  To leverage streaming data effectively, you need a set of systems and processes that enable you to transform raw streaming data through the full data value-stream in real-time.  You can’t wait for batch data updates, latency in analytics processing, or manual integration of data.  You need the entire process to be automated and optimized.

Actian can help.  Actian, the hybrid data management, analytics, and integration company, delivers data as a competitive advantage to thousands of organizations worldwide. Actian Avalanche is a fully managed hybrid cloud data warehouse service designed from the ground up to deliver high performance at a fraction of the cost of alternative solutions. It is the first and only data warehouse to provide comprehensive integration capabilities, including connecting to on-premise and SaaS applications as well as managing those integrations.

For more information, visit https://www.actian.com.

Is your Integration Platform Ready to Embrace Emerging Technology Trends?

$
0
0

Feed: Actian.
Author: Sampa Choudhuri.

Some exciting technology trends are emerging that are projected to hit the mainstream over the next few years that will have a significant impact on your data management systems.  Will your integration platform be ready to support these new trends?  If not, now is the time to act so you will be prepared to support a new wave of business capabilities your company will need to succeed.

Emerging Technology Trends that are Poised to Disrupt the Status Quo

The IT industry is changing rapidly, and there are 4 key emerging technology trends that data management and IT professionals should be monitoring closely.

  1. Cloud-native architectures – Companies are rapidly shifting from home-grown systems to cloud services, both platforms and SaaS. These cloud services leverage cloud-native architectures that are often highly distributed, leverage parallel processing, involve non-relational data models, and can be spun up or shut down in a matter of seconds.  Integrating data from these systems can be challenging for legacy data integration systems that require manual configuration of each data connection.

Your integration platform needs to be able to recognize and adapt to these cloud-native architectures and enable your business and IT teams to make frequent changes to the application landscape while maintaining the integrity and security of underlying enterprise data assets.

  1. Event-driven applications – Traditional IT applications were built around structured workflows that were well defined, much like a novel. Modern “event-driven” applications are more like a “choose your own adventure” book, where the end-to-end transaction flow may not be pre-defined at all. Events and data are evaluated, leading to dynamic workflows emerging based upon the needs of the individual transaction.  Many cloud-based container apps and functions are being used to deploy capabilities this way.

The challenge event-driven applications pose to data management is that they lack the data context that traditional application workflows provide.  Context is derived from the series of events and actions that led to the current point in time.  Your integration platform will need to understand and be able to support the unique nuances of these event-driven applications and contextualize the data they produce differently.

  1. API led integration – Similar to event-driven applications, API led integration is a new model for bringing IT capabilities together. Applications are treated as pseudo-black boxes, and what is managed in a structured way is the interfaces between them. From a data management perspective, this raises the need to manage data in motion (traveling between apps over APIs) as well as data at rest (within individual applications).  Your integration platform will need to understand the differences between these two types of data and be able to ingest, transform, and load them together in your data warehouse for further processing.
  2. Streaming data – Companies in all industries are now being inundated with streaming data coming from a variety of data sources – IoT, Mobile apps, deployed sensors, cloud services, and digital subscriptions are a few examples.  The data these systems generate is significant, and in even a small organization, the number of data sources can be extensive.  When you multiply large data streams across many data sources, the streaming data volume that a company needs to manage can be massive.

Most legacy integration platforms were designed for batch data processing, not the scale challenges of streaming data.  Cloud-based integration platforms are often better suited to address streaming data needs than on-premise systems because of the underlying capacity of the cloud environments where they operate.

Is Your Integration Platform Ready?

If you aren’t sure whether your integration platform is up to the task of supporting these emerging technologies, it probably isn’t.  Actian DataConnect is a modern hybrid integration platform that leverages cloud-scale and performance to deliver the capabilities you need to connect anything, anytime, anywhere, and integrate it into your enterprise data landscape.  To learn more about how DataConnect can help you prepare for these and other emerging technology trends, visit www.actian.com/dataconnect

tsmp v0.4.8 release – Introducing the Matrix Profile API

$
0
0

Feed: R-bloggers.
Author: Francisco Bischoff.

[This article was first published on R-posts.com, and kindly contributed to R-bloggers]. (You can report issue about the content on this page here)
Want to share your content on R-bloggers? click here if you have a blog, or here if you don’t.

A new tool for painlessly analyzing your time series

We’re surrounded by time-series data. From finance to IoT to marketing, many organizations produce thousands of these metrics and mine them to uncover business-critical insights. A Site Reliability Engineer might monitor hundreds of thousands of time series streams from a server farm, in the hopes of detecting anomalous events and preventing catastrophic failure. Alternatively, a brick and mortar retailer might care about identifying patterns of customer foot traffic and leveraging them to guide inventory decisions.

Identifying anomalous events (or “discords”) and repeated patterns (“motifs”) are two fundamental time-series tasks. But how does one get started? There are dozens of approaches to both questions, each with unique positives and drawbacks. Furthermore, time-series data is notoriously hard to analyze, and the explosive growth of the data science community has led to a need for more “black-box” automated solutions that can be leveraged by developers with a wide range of technical backgrounds.

We at the Matrix Profile Foundation believe there’s an easy answer. While it’s true that there’s no such thing as a free lunch, the Matrix Profile (a data structure & set of associated algorithms developed by the Keogh research group at UC-Riverside) is a powerful tool to help solve this dual problem of anomaly detection and motif discovery. Matrix Profile is robust, scalable, and largely parameter-free: we’ve seen it work for a wide range of metrics including website user data, order volume and other business-critical applications. And as we will detail below, the Matrix Profile Foundation has implemented the Matrix Profile across three of the most common data science languages (Python, R and Golang) as an easy-to-use API that’s relevant for time series novices and experts alike.

The basics of Matrix Profile are simple: If I take a snippet of my data and slide it along the rest of the time series, how well does it overlap at each new position? More specifically, we can evaluate the Euclidean distance between a subsequence and every possible time series segment of the same length, building up what’s known as the snippet’s “Distance Profile.” If the subsequence repeats itself in the data, there will be at least one match and the minimum Euclidean distance will be zero (or close to zero in the presence of noise).

In contrast, if the subsequence is highly unique (say it contains a significant outlier), matches will be poor and all overlap scores will be high. Note that the type of data is irrelevant: We’re only looking at pattern conservation. We then slide every possible snippet across the time series, building up a collection of Distance Profiles. By taking the minimum value for each time step across all distance profiles, we can build the final Matrix Profile. Notice that both ends of the Matrix Profile value spectrum are useful. High values indicate uncommon patterns or anomalous events; in contrast, low values highlight repeatable motifs and provide valuable insight into your time series of interest. For those interested, this post by one of our co-founders provides a more in-depth discussion of the Matrix Profile.


Although the Matrix Profile can be a game-changer for time series analysis, leveraging it to produce insights is a multi-step computational process, where each step requires some level of domain experience. However, we believe that the most powerful breakthroughs in data science occur when the complex is made accessible. When it comes to the Matrix Profile, there are three facets to accessibility: “out-of-the-box” working implementations, gentle introductions to core concepts that can naturally lead into deeper exploration, and multi-language accessibility. Today, we’re proud to unveil the Matrix Profile API (MPA), a common codebase written in R, Python and Golang that achieves all three of these goals.

Using the Matrix Profile consists of three steps. First, you Compute the Matrix Profile itself. However, this is not the end: you need to Discover something by leveraging the Matrix Profile that you’ve created. Do you want to find repeated patterns? Or perhaps uncover anomalous events? Finally, it’s critical that you Visualize your findings, as time series analysis greatly benefits from some level of visual inspection.

Normally, you’d need to read through pages of documentation (both academic and technical) to figure out how to execute each of these three steps. This may not be a challenge if you’re an expert with prior knowledge of the Matrix Profile, but we’ve seen that many users simply want to Analyze their data by breaking through the methodology to get to a basic starting point. Can the code simply leverage some reasonable defaults to produce a reasonable output?

To parallel this natural computational flow, MPA consists of three core components:

  1. Compute (computing the Matrix Profile)
  2. Discover (evaluate the MP for motifs, discords, etc)
  3. Visualize (display results through basic plots)

These three capabilities are wrapped up into a high-level capability called Analyze. This is a user-friendly interface that enables people who know nothing about the inner workings of Matrix Profile to quickly leverage it for their own data. And as users gain more experience and intuition with MPA, they can easily dive deeper into any of the three core components to make further functional gains.

As an example, we’ll use the R flavour of MPA to analyze the synthetic time series shown below (here is the code):

Visual inspection reveals that there are both patterns and discords present. However, one immediate problem is that your choice of subsequence length will change both the number and location of your motifs! Are there only two sinusoidal motifs present between indices 0-500, or is each cycle an instance of the pattern? Let’s see how MPA handles this challenge:


Because we haven’t specified any information regarding our subsequence length, `analyze` begins by leveraging a powerful calculation known as the pan-matrix profile (or PMP) to generate insights that will help us evaluate different subsequence lengths. We’ll discuss the details of PMP in a later post (or you can read the associated paper), but in a nutshell, it is a global calculation of
all possible subsequence lengths condensed into a single visual summary. The X-axis is the index of the matrix profile, and the Y-axis is the corresponding subsequence length. The darker the shade, the lower the Euclidean distance at that point. We can use the “peaks” of the triangles to find the 6 “big” motifs visually present in the synthetic time series.
The PMP is all well and good, but we promised a simple way of understanding your time series. To facilitate this, `analyze` will combine PMP with an under the hood algorithm to choose sensible motifs and discords from across all possible window sizes. The additional graphs created by `analyze` show the top three motifs and top three discords, along with the corresponding window size and position within the Matrix Profile (and, by extension, your time series).
Not surprisingly, this is a lot of information coming out of the default setting. Our goal is that this core function call can serve as a jumping-off point for many of your future analyses. For example, the PMP indicates that there is a conserved motif of length ~175 within our time series. Try calling `analyze` on that subsequence length and see what happens!


We hope that MPA enables you to more painlessly analyze your time series! For further information, visit our website (https://matrixprofile.org/), GitHub repos (https://github.com/matrix-profile-foundation) or follow us on Twitter (https://twitter.com/matrixprofile). MPF also operates a Discord channel where you can engage with fellow users of the Matrix Profile and ask questions. Happy time series hunting!
Acknowledgements

Thank you to Tyler Marrs, Frankie Cancino, Francisco Bischoff, Austin Ouyang and Jack Green for reviewing this article and assisting in its creation. And above all, thank you to Eamonn Keogh, Abdullah Mueen and their numerous graduate students for creating the Matrix Profile and continuing to drive its development.

Supplemental

  1. Matrix Profile research papers can be found on Eamonn Keogh’s UCR web page: https://www.cs.ucr.edu/~eamonn/MatrixProfile.html
  1. The Python implementation of Matrix Profile algorithms can be found here: https://github.com/matrix-profile-foundation/matrixprofile
  1. The R implementation of Matrix Profile algorithms can be found here: https://github.com/matrix-profile-foundation/tsmp
  1. The Golang implementation of Matrix Profile algorithms can be found here: https://github.com/matrix-profile-foundation/go-matrixprofile


If you got this far, why not subscribe for updates from the site? Choose your flavor: e-mail, twitter, RSS, or facebook

Enabling Customer Attribution Models on AWS with Automated Data Integration

$
0
0

Feed: AWS Partner Network (APN) Blog.
Author: AWS Admin.

By Charles Wang, Product Evangelist at Fivetran

Every company wants to understand the levers that influence customers’ decisions. Doing so requires a chronology of a customer’s interactions with a company to identify the events and experiences that influence their decision to buy or not.

Attribution models allow companies to guide marketing, sales, and support efforts using data, and then custom tailor every customer’s experience for maximum effect.

In this post, I will discuss how simple data integration can be, how it enables customer analytics, and how customer data can be used to build attribution models to uncover what makes customers tick.mar

Fivetran is an AWS Partner Network (APN) Advanced Technology Partner and data pipeline tool that provides automated data connectors to integrate data into data warehouses such as Amazon Redshift. Fivetran has earned the Amazon Redshift Ready designation.

Combined together, cloud-based data pipeline tools and data warehouses form the infrastructure for integrating and centralizing data from across a company’s operations and activities, enabling business intelligence and analytics activities.

Customer Analytics Requires Data Integration

With the growth of cloud-based services, the average business now uses more than 100 applications. These systems generate an enormous volume of data that contain insights about an organization’s operations and customer interactions.

However, data can be useless to an organization that lacks the capacity to integrate and analyze it. In fact, a majority of commercial data is thought to consist of dark data, which is collected and processed but not used for analysis. To build attribution models, an organization needs to integrate and centralize data from its applications, databases, event trackers, and file systems.

As with many other business operations—e-commerce, customer relationship management, payment processing, and more—there is no need for an organization to build tools for data integration in-house when a software-as-a-service (SaaS) product that accomplishes the same tasks already exists.

Data pipeline tools like Fivetran provide data connectors to integrate data from API endpoints, database logs, event streams, and files. Every data connector is built and maintained by an expert team that understands the idiosyncrasies of the underlying data source, is stress-tested against a range of corner cases, and operates with minimal intervention by the end user.

Connectors bring data from data sources to a data warehouse on a regular sync schedule, and, when managed by a conscientious team, will automatically adapt to schema and API changes.

Similarly, data warehouses like Amazon Redshift allow organizations to maintain a single source of truth in the form of a relational database. Cloud-based data warehouses offer excellent, parallelized performance, the ability to scale computation and storage resources up and down as needed, and the ability to conduct analytics operations using SQL.

An effective data stack—with a data pipeline, data warehouse, and business intelligence tool carefully selected to meet your needs—allows you to focus on what your analysts and executives really care about, which is understanding your customers so that your organization can do its best work.

The following diagram illustrates the stack:

Fivetrain-Redshift-1

Figure 1 – A data stack consists of data sources, pipeline, data warehouse, and BI tool.

Fivetran, Redshift, and Customer Attribution in the Real World

The design and stationery company Papier relied heavily on paid marketing to drive sales. Shortly before adopting Fivetran, Papier began to use Amazon Redshift as a central repository for ad, transaction, and clickstream data.

Originally, the CTO used custom extract, transform, and load (ETL) scripts and infrastructure code to import data from ad providers and other sources.

This home-brewed approach introduced inaccuracies and inconsistencies to the data, forcing the team to frequently re-sync the data at the cost of substantial downtime. The CTO would personally spend one full working day per week resolving ETL issues.

This time investment proved untenable as Papier continued to grow and add data sources. They needed an automated solution that accommodated a wide range of data sources with a minimum of human intervention and data integrity issues.

Combining Fivetran and Redshift allowed Papier to connect data from ad providers with purchases, enabling them to calculate the lifetime value of customers and grasp the ROA and ROI on advertising campaigns. With this solution, Papier is now able to pursue product roadmaps with far greater strategic depth.

Fivetran and Amazon Redshift provide an off-the-shelf solution to the challenge of putting the relevant records into one environment. Learn more about the Fivetran and Papier case study >>

How to Integrate Data

It’s extremely simple to connect Amazon Redshift with Fivetran and begin integrating data. Before you start, you must have the following:

  • Access to your AWS console so you can whitelist Fivetran IP addresses.
  • Ability to connect an admin user, or have permissions to create a limited user with CREATE permissions.
  • An existing Redshift instance.

Make sure you have the following information handy as well:

For detailed instructions on authorizing your Redshift cluster to connect with Fivetran, see the documentation.

The workflow for setting up Fivetran is extremely simple:

  • Upon starting a Fivetran account, you’ll be prompted to choose an existing data warehouse or spin up a new one. Choose I already have a warehouse.
  • You’ll then see a list of data warehouse options. Select Redshift.

Fivetrain-Redshift-2.1

Figure 2 – Setting up Amazon Redshift data warehouse in Fivetran.

  • Enter your credentials and choose whether you’ll connect directly or via SSH tunnel. Click Save and Test.
  • Now, you will subsequently be able to access the Fivetran dashboard. From here, you can set up new connectors to begin syncing data to your data warehouse. Click + Connector or Create Your First Connector.
  • You will be taken to a list of connectors, and you can scroll or filter by text. Click on the desired entry in the list.

To set up the connector, you must enter the credentials to the API, transactional database, event tracker, or file system. Below is an example of the interface for a transactional database connection.

Fivetrain-Redshift-2

Figure 3 – These fields should be familiar if you regularly work with database connections.

Below is an example of an app connection. Clicking Authorize takes you to the app itself, where you must authorize the connection.

Fivetrain-Redshift-3

Figure 4 – Carefully select the destination schema and table in the data warehouse.

Next, here’s an example of the interface for an event tracker.

Fivetrain-Redshift-4

Figure 5 – Specify the destination schema, and then insert the code snippet into your HTML.

In the examples above, we have demonstrated that setting up data integration is a matter of following a relatively simple sequence of steps. But how do you actually build an attribution model?

How to Approach Customer Attribution

Depending on the particulars of an industry, your customers may interact with your company across any of the following platforms:

  • Advertising
  • Social media
  • Website or mobile app event tracking
  • Customer relationship management tools
  • E-commerce
  • Payment processing

Ideally, you should assemble a full chronology of the customer’s journey from the first touch all the way to purchase. This allows you to understand the inflection points that make or break a potential purchase.

Depending on the exact goods and services your organization provides, customers could conceivably have multiple journeys as they make recurring purchases.

A general representation of a customer journey consists of the following steps:

  • Discovery: Customers realize they have a want or need.
  • Research: Compares vendors and products.
  • Engage: Enters your (virtual or brick-and-mortar) storefront, browses, and speaks with your sales staff.
  • Purchase: Customer purchases the product or service.
  • Retain: Returns to the vendor for future purchases.

Suppose you run an e-commerce store; concretely, a customer journey may look like this:

  1. Customer learns of a new type of product through their acquaintances and searches for it online.
  2. A social media site uses cookies from the customer’s search history and surfaces a banner ad for your company, who finds it and clicks it while browsing social media. The interaction is recorded by your social media advertising account.
  3. Customer arrives at your website via the banner ad and begins reading reviews and browsing your blog out of curiosity. Every page the customer visits on your site is recorded by your event tracking software.
  4. Customer adds items to their cart and creates an account on your site. Your e-commerce platform records the prospective transactions.
  5. Customer abandons the cart for a few days as other priorities draw their attention, but is reminded by your email marketing software that their cart has items. The customer clicks on a CTA to complete the order. The email marketing software records this interaction.
  6. Both the e-commerce platform and online payment processing platform record the transaction when the customer completes the order.
  7. A week or so later, the customer leaves a review on your company’s social media profile.

Note how the steps above spanned six distinct platforms operated by your company: social media advertising, website event tracking, e-commerce, email marketing, payment processing, and social media.

To build a chronology of this customer’s interactions, you must put the relevant records into one environment and attribute them to the same customer.

How to Identify Customers Across Platforms

Our example in the previous section demonstrates just how complicated the customer flow can be in terms of traversing various platforms. That’s to say nothing of the possibility your customers switch from mobile to desktop devices, or from home networks and coffee shops to office networks over the course of a single day.

There are no perfect solutions, but you can use several identifiers to distinguish between customers, devices, and campaigns across their web-based activities.

  • IP addresses are unique at the network level, so all web-connected devices in the home or office might have the same IP address. If you are a B2B company and have engaged the services of a market research company, there’s a chance they can associate an IP address with the name of a company.
  • Cookies are tags assigned to a browser session.
  • User agents provide information about users’ browser, operating system, and device.
  • Email and social media are two ways that users can register with your site, and you can use these accounts as identifiers. You’ll have to determine the trade-off between the convenience, to you, of requiring registration and login, and the convenience to users of using your website without an account.
  • UTM extensions can be used to distinguish different sources of traffic. A link to a page from social media may be tagged with character suggest.

Examples of Attribution Models

Once you have assembled a chronology of customers’ interactions with your company, you’ll need to determine which steps in the process mattered most. There are several classic customer attribution models, each assigning different weights to different stages of a customer interaction.

The simplest attribution models are single-touch, and only require you to be certain of the first or last interaction your customer has with your company.

Last-Touch Attribution

Last-touch attribution attributes 100 percent of the credit for a sale to the last interaction between the customer and your company.

This is the default approach used by marketers and the simplest to implement; all you have to know is the last thing the customer did before purchasing.

Fivetran-AWS-Redshift-5.1

First-Touch Attribution

First-touch attribution attributes 100 percent of the credit for a sale to the first interaction between the customer and your company.

Like last-touch attribution, it’s suitable to cases where your company has low brand recognition or a very short sales cycle.

Fivetran-AWS-Redshift-6.1

U-Shaped Attribution

U-shaped attribution, also called “position-based,” attributes the lion’s share of credit to the first and last interactions, while dividing the remainder among the other interactions.

This allows the interactions that are generally considered the most important—the first and last—to be strongly considered without ignoring the rest.

Suppose the customer had four recorded interactions with your company. The first and last interactions might each receive 40 percent of the credit, while the two middle interactions receive 10 percent each.

Fivetran-AWS-Redshift-7.1

.
It could also be 50/0/0/50 if you don’t care at all about the middle interactions.
.

Fivetran-AWS-Redshift-8.1

Linear Attribution

Linear attribution is strictly agnostic and assigns equal weight to every interaction. This is a good approach if you don’t have any prior, compelling beliefs about the importance of any particular interaction.

Fivetran-AWS-Redshift-9.1

Decay Attribution

Decay attribution gradually assigns more weight the closer an interaction is to the last. It’s best suited to cases where a long-term relationship is built between your company and the customer.

Fivetran-AWS-Redshift-10.1

Next Steps

Customer analytics does not end with the models mentioned above. More sophisticated custom models, built off of Markov chains or survival modeling, are a next step. It doesn’t hurt to sanity check quantitative work with the qualitative step of simply asking your customers what they do, either.

With the proliferation of applications, platforms, and devices, and constant growth of data, it’s hard enough to match records across the multitude of data sources and touch points your organization uses when they are already in one place.

Without a data pipeline tool like Fivetran and a data warehouse like Amazon Redshift, the task of integrating data can be insurmountable.

Summary

In this guide, we have explored how analytics depend on a robust data integration solution and offered a practical guide to getting started with data integration and customer attribution.

Customer attribution models require the ability to match entities across multiple data sources. This requires a cloud-based data pipeline tool, and a cloud data warehouse like Amazon Redshift.

You should not build your own data connectors between your data sources and data warehouse. Doing so is complicated and error-prone. You should prefer automation to manual intervention wherever possible. A good data integration solution should require a relatively simple setup procedure.

There are a number of different approaches to modeling customer journeys, identifying customers, and producing customer attribution models. Different approaches are appropriate for different use cases. Pick and choose based on your needs.

The content and opinions in this blog are those of the third party author and AWS is not responsible for the content or accuracy of this post.

.
Fivetran-APN-Blog-CTA-1
.


Fivetran – APN Partner Spotlight

Fivetran is an Amazon Redshift Ready Partner. Its data pipeline tool provides automated data connectors to integrate data into data warehouses such as Redshift.

Contact Fivetran | Solution OverviewAWS Marketplace

*Already worked with Fivetran? Rate this Partner

*To review an APN Partner, you must be an AWS customer that has worked with them directly on a project.

Best Slack Alternatives for 2020: Time to Off Slack

$
0
0

Feed: Cloudwards.
Author: Steve Iva
;

Slack is one of the biggest cloud-based instant messaging platforms in the world. Started in 2013 as an internal communication tool by Stewart Butterfield, Eric Costello, Cal Henderson and Serguei Mourachov, it soon became a product for the external market and is now used daily by more than 10 million people.

With everything that Slack has to offer, users don’t actually need to consider a change, but for those who like to experiment or simply don’t feel comfortable with Slack having access to all your company’s data, there are some really good Slack alternatives out there.

In this review, we’ll compare some of the most popular alternatives — including Twist, Discord, Rocket.Chat and many more — in terms of features and pricing. We’ll also have a look at some of the most popular open-source alternatives.

What Is Slack?

Simply put, Slack is a chat app that enables you to communicate with your team via messaging. No matter if you want to work with your team on an important sales presentation or if you use Slack for your science project at college, its core function stays the same.

The platform itself is designed to replace emails through messages and centralize all communication in the most important channels. You can also message your team members directly or open so-called “private” invite-only channels. Besides, you can upload files, start chat threads and much more. Slack comes with a desktop app and a mobile app.

best-slack-alternatives-slack

The 7 Best Slack Alternatives

  1. Twist
  2. Discord
  3. Flock
  4. Glip
  5. Rocket.Chat
  6. Zulip
  7. Mattermost

Now that we talked a bit about Slack, let’s talk about its alternatives. In the following chapter, we’ll discuss several chat services and directly compare their functions and pricing with Slack’s.

The first provider in our comparison is called Twist. Above all, Twist wants to stand out from Slack in the way people use it to communicate. Slack can easily become a distraction, especially with larger teams. On top of that, it’s quite difficult to search for specific messages, and information quickly gets lost. 

Twist, therefore, doesn’t focus on real-time communication. Instead, it lets teams communicate in their own flow and velocity, and it structures the messages more clearly. It even has an entire page on its homepage explaining the difference.


Twist Key Features

Twist organizes conversations in so-called “threads,” which are a mixture of email and messaging where the focus, again, is not on being available in real time. Threads are the core feature of Twist and allow you to orchestrate your communication by topics. Its interface, however, reminds us of Microsoft Outlook. 

Another useful feature that Twist comes with is disabling notifications. You can do this with Slack, too, but it’s easier to set up in Twist and your team members will see that your account is “off shift,” so to say.


Twist Pricing

Twist has two different plans, which makes its pricing pretty straightforward.

Free: Unlimited:
$0.00 $5 per user per month

The free plan gives you access to your chat and comment history for a month. It also allows up to five different third-party integrations, and the entire workspace has 5GB of file storage. You can use the free plan for an unlimited amount of time, and your previous messages won’t be deleted. If you need to access these messages, you can simply upgrade your plan.

The Unlimited package comes with monthly costs of $5 per user, and it allows you to access your entire chat history, integrate as many third-party apps as you want and have unlimited file storage.


The second provider in our best Slack alternatives article is Discord. Primarily made for gamers, it enjoys increased popularity today among engineers and other digital experts. Its in-built voice and chat functions make it particularly useful for teams working on more complex projects.


Discord Key Features

With TeamSpeak being its biggest competitor, Discord’s mission is to revolutionize the way gamers communicate during hour-long raids and matches. Nevertheless, you can use it for all kinds of things. 

There are private and public servers, depending on how you want to use Discord. With public servers, as the name suggests, anyone can join or leave the server. With private servers, that’s not the case.

For example, Vue.js — a very popular JavaScript framework and open-source project — has its own Discord server. Vue Land is a place where people discuss everything related to Vue.js.

That being said, Discord is not only a pure chat and gaming tool, it also helps you to build forums and communities, plus orchestrate larger teams. Like with all other providers in this article, the communication is separated into channels and direct messages. 

Discord Pricing

Discord comes with the following plans:

Billing Period: Free Discord Nitro Classic Discord Nitro
When billed annually $0.00 $4.16 (per user per month) $8.33 (per user per month)
When billed monthly $0.00 $4.99 (per user per month) $9.99 (per user per month)

First of all, Discord comes with an amazing free plan, but there are also a few upgrades for your server and extended chat functions that you can buy. The upgrades are mostly distinguished between server-side upgrades and additional features. Depending on what features you’re looking for, you’d need to choose the right plan.


Discord Pricing

While the Discord Nitro plan includes both better server and chat functions, the Discord Nitro Classic plan only covers the latter. 


Flock calls itself the number-one team messenger. That’s a strong statement for a company with the mission to basically underprice Slack. We couldn’t find out how many people actually use Flock.


Flock Key Features

Flock offers the most important chat features that Slack does. It provides a few things that Slack doesn’t, but some of those are useless, in our opinion. For example, Flock gives you the ability to prevent certain members from leaving a channel. 

Another feature is the “read by” option, which means that you can see who has or hasn’t read your message. You can also enable notifications when employees come online. The built-in GitHub integration is also useful, but it’s nothing you can’t set up or integrate into Slack.

However, the “read by” function is a break of trust and not really useful if you want to build camaraderie within a team, if you ask us.

Flock Pricing

Flock’s founder, Bhavin Turakhia, an Indian billionaire, advertises Flock as being a cheaper version of Slack. Once again, it becomes clear that Flock is very aggressive on pricing. Among other things, it has a page where it directly compares Slack and Flock.


According to its website, Flock is up to 64 percent cheaper than Slack. After doing some digging, though, we found out that it compares the smallest Flock plan with the largest Slack plan. Flock has three levels of pricing: the Starter plan, Pro plan and Enterprise plan.

Billing Period: Starter Plan Pro Plan Enterprise Plan
When billed annually $0.00 $4.50 per user per month $8 per user per month
When billed monthly $0.00 $6 per user per month $10 per user per month


Glip today is a service of RingCentral, a cloud-communications provider from California. Glip was acquired by RingCentral in 2015 and has been an integral part of its service portfolio ever since. 


Glip Key Features

Like almost every other Slack alternative, Glip has its own website page where you can compare it with its competitors. Unlike other providers, Glip brings a comparison that actually makes sense.


If you compare the free plans of Glip and Slack, you will see that the free version of Glip beats the free version of Slack. With many unlimited features, it can be helpful to use Glip, especially for smaller teams. 

What’s particularly great here is that both the free and paid versions of Glip come with a task manager and calendar that you can work with as a team. 

In Glip, you can create a task, set a deadline and have dashboards where all your tasks are visible at a glance. These features make collaboration in a team much easier. To replicate such a setup with Slack, you might need a Trello board, as well.

Glip Pricing

Glip’s pricing plan is pretty straightforward. It comes with a free and paid version.

Billing Period: Free Standard
When billed annually $0.00 $60 per user
When billed monthly $0.00 $5 per user

The free version comes very close to the paid version, feature-wise. The only real obstacle you’re going to face on a free plan is the fact that Glip limits the video-chat function to 500 minutes. If you want to continue using this feature after 500 minutes, you will need to upgrade to its Standard (paid) plan.

However, you will also get Glip’s data retention policy and compliance exports only by switching to a paid plan. 


At first sight, Glip looks like one of the cheaper Slack alternatives. However, here comes the sore truth: if you want to switch to its paid plan, you first have to create a RingCentral account. 

After we talked to its support, it turns out that a RingCentral account isn’t free. How much exactly you have to spend per month for such an account is unclear. You will also need a RingCentral account to install Glip on your Mac or Windows device.

Open-Source Slack Alternatives

Now that we have talked about paid versions in detail, we would like to discuss the best open-source Slack alternatives.

Open-source software is great. If you are tech-savvy, you can adapt and extend the existing chat platforms according to your wishes. Another good thing about open-source software is that you can install the platform on your own server if you don’t want a third party to have access to your data. 

Rocket.Chat is one of many open-source alternatives to Slack. You can use Rocket.Chat with its cloud and pay for it, or you can download and install it on a server yourself. The latter would require you to have some kind of hosting solution ready (check out our web hosting review).


Rocket.Chat Key Features

The Rochet.Chat app mostly looks like Slack and doesn’t differ much in its features. Rocket.Chat offers two features we’d like to highlight in particular. 

The first one is the Slack importer, which allows you to migrate your data from Slack directly to Rocket.Chat. The other is a chat widget: you simply insert a piece of code into your website and will be able to chat with your website visitors through Rocket.Chat.

You can also customize your platform and tailor its exact look and feel by adding or removing features and selecting your own integrations, plugins and themes —  basically all the advantages an open-source platform comes with.

Rocket.Chat Pricing

As we already mentioned, you can use Rocket.Chat through its cloud or by hosting it yourself. If you host it on your own server, Rocket.Chat comes with the following plans:

Billing Period: Community Pro
When billed annually $0.00 $2.5 per user per month
When billed monthly $0.00 $3 per user per month

The free Community plan allows you to have up to 1,000 users and doesn’t limit you in terms of messaging or accessing your message history. It also doesn’t limit you in the number of third-party integrations. 

You can even use Rocket.Chat for conference calls, but on a shared server. If you would like your conferences to be held on a dedicated server, you’ll need to upgrade to the Pro plan.

The Pro plan costs $3 per user per month if you’re billed monthly and $30 per user per year if you’re billed annually. It unlocks a decent number of features, like the multi-language interface, and it comes with support. Both plans run on every common operating system.


If you want to use Rocket.Chat through its cloud, you can choose between the following packages:

Billing Period: Bronze Silver
When billed annually $1.66 per user per month $3.33 per user per month
When billed monthly $2 per user per month $4 per user per month

The smallest cloud-based plan, the Bronze plan, gives you 1TB of storage, five third-party integrations and covers the most important chat basics for you and your team. It comes with basic support, daily analytics and backups. 

The Silver plan is the second-biggest option and costs a bit more than the Bronze plan. It costs $4 per month per user when billed monthly or $40 per user per year when billed annually. 

You get up to 5TB of storage for your team, plus you can integrate 100 third-party applications into your Rocket.Chat workspace and you can set it up with a custom domain.

There’s also a Gold plan, which requires you to contact the Rocket.Chats sales team to get tailored pricing. You get 20TB of storage and up to 1,000 integrations, plus your analytics reports and backups are done hourly.

You get the Rocket.Chats best support your money can buy, which means you can talk to Rocket.Chat’s product team, have dedicated onboarding calls and much more.


Zulip started as a small open-source project and was bought by Dropbox in 2014. Dropbox decided to continue offering the service as open-source software. With a very active community, Zulip is a notable open-source Slack alternative.


Zulip Key Features

Unlike Slack, Zulip allows communication in so-called “topics.” Each channel (in Zulip, they are called “streams”) has several sub-topics that allow you to simplify communication. It’s a useful feature, especially for larger teams. 

Another advantage of Zulip is that it’s open-source and if you want to add a new feature, you can either develop it yourself or simply suggest it to the community with good chances that it’ll be implemented.

Zulip Pricing

Similar to Rocket.Chat, Zulip also has two pricing models: one when you use it with its cloud and one when you install it locally on your own server. Zulip’s cloud service comes with a free plan and a paid plan.

Billing Period: Free Standard
When billed annually $0.00 $6.67 per user per month
When billed monthly $0.00 $8 per user per month

The two plans differ in terms of functions. The free plan limits you to 5GB of storage for the entire workplace and you can only access the last 10,000 messages, just like Slack’s free plan. If you upgrade to Zulip’s Standard plan, the limit will be removed and your storage will increase to 10GB per user.


If you want to install Zulip yourself, you can choose between the Community Edition and the Enterprise Edition. While the Community Edition is and will remain free of charge, the Enterprise Edition comes with a fee.

The Community and Enterprise Editions don’t differ when it comes to functionality, but they do differ in support. With the Enterprise Edition, your tickets will be prioritized, and you will get better and faster help.


All in all, Zulip is an average service that brings a little more structure to the way people communicate, but that’s about it.

Last but not least, let’s talk about Mattermost. Mattermost was founded in 2011 as an internal chat app, because at that time (before Slack was developed), the developers with SpinPunch, a video game company, were not really satisfied with the available chat programs at that time.

Mattermost was later made available to the public in 2015 as an open-source chat option.


Mattermost Key Features

The Mattermost credo, above all, is to move away from SaaS chat apps. Based on their personal experience, the developers had problems with existing SaaS apps (they had to pay money to get access to their data, among other things). That is why they decided to build Mattermost, following their own Mattermost manifesto.

Anyone who reads the manifesto understands that Mattermost would like to distinguish itself from Slack and other vendors, above all, in terms of data protection and not in terms of functionality. The first point, in particular — “never locked-in” — is clearly reflected in the corporate strategy of Mattermost.

Mattermost is available on Linux, Windows, macOS, Android and iOS.

Mattermost Pricing

With Mattermost offered as open-source, you can install three different versions: the Team Edition, the Enterprise E10 plan and the Enterprise E20 plan. While the Team edition is completely free, the following prices apply to the other two plans.

Billing Period: Team Edition Enterprise E10 Enterprise E20
When billed annually $0.00 $3.25 per user per month $8.50 per user per month

Unlike the previous open-source alternatives, there is no cloud version of Mattermost, which is self-explanatory if you’ve read its history and manifesto.

With the free version, you get the most important chat features. If you upgrade to Enterprise E10, you will also get support within the next business day, the ability to invite guest accounts to your workplace and other technical features. 

If you want to create team-based permissions, have data center support or receive help with your compliance policy, you will need to upgrade to Enterprise E20.


Slack Key Features

Here’s an overview of the most important key features of Slack, which we used as a basis for comparing it with other options.

  • Communication in channels: as we already mentioned, all communication in Slack can happen in channels or in private messages. Channels are especially useful for larger teams.
  • Shared channels across workspaces: if you’re working on a project with another company, you can easily create shared channels across workspaces. This allows you to funnel the communication with people outside of your organization in one place. This feature, however, is only part of paid plans.
  • File-share: you can upload, track, manage and comment on files that you can share with your team.
  • Pinning messages: this is a key feature for bigger companies where messages are lost easily. When you pin a message, you basically highlight it in the channel and make sure everyone sees it.
  • Advanced search and modifiers: with all the communication happening in one place, things can quickly get messy. That’s where advanced search modifiers come in handy because they allow you to search more specific information (e.g., certain dates, channels and much more).
  • Setting reminders: reminders are a good way to keep track of what is important and to remind yourself of events or deadlines. 
  • Integrate third-party apps: Slack also allows you to integrate third-party apps — such as Google Drive, Trello, Zapier and lots of other useful stuff — to automate certain processes.
  • Voice and video calls: with Slack’s free plan, you can do one-to-one calls (voice and video). If you upgrade to a paid plan, you can also share your screen during calls and start audio or video conferences with more people.

The features we mentioned in our list are impressive, and Slack has even more to offer, but we wanted to focus on the most important ones.

Slack Pricing

Slack’s pricing is pretty simple, as you can see in the table below.

Billing Period: Free Standard Plus
When billed annually $0.00 $6.67 per user per month $12.50 per user per month
When billed monthly $0.00 $8 per user per month $15 per user per month

The free plan is for smaller teams who want to try out Slack. The service is free for an unlimited period of time, but it limits your access to your chat history. With this plan, you have access only to the last 10,000 messages.

It also limits the number of third-party apps per workspace. When you open a Slack workspace on the free plan, you really need to trust your team members. That’s because you can set certain permissions only for the #general-channel, which is the standard channel that comes with each new workspace.


The Standard plan is billed $6.67 per month for every active user, if you choose to be billed annually. On a month-to-month basis, however, it’s $8 per month for every active user. On a yearly basis, you’ll pay either $80.04 or $96 per user.

On this plan, you’re able to search through your entire chat history and integrate an unlimited number of third-party apps. Your file storage for Slack also gets an upgrade. While on the free plan, you’re limited to 5GB in total, but with the Standard plan, every team member gets 10GB. You also get 24/7 support, instead of standard support.


The Plus package costs $12.50 per month per active user when billed annually, while the month-per-month option costs $15. That being said, you’d pay between $150 and $180 per user per year on this plan.

This package gives you 20GB of file storage per user, priority support — including in-language support during regional business hours — and much more.

Last but not least, there is the Enterprise Grid plan, which allows you to run multiple workspaces and have tailored support with a designated customer success team, but it also comes with a tailored price tag.

Final Thoughts

This was our detailed comparison of the best Slack alternatives. Ironically, for vendors that offer software designed to simplify communication in teams, some of them struggle quite a bit to communicate with the outside world. 

We all know that Slack is awesome to use and has a lot of features, but its competitors have some good and useful features to offer, too. If you’re looking for a great, free Slack alternative, check out Discord. 

Those who want to have full control over their communication and data should rely on open-source software. Among the open-source providers, we especially recommend Rocket.Chat and Mattermost. 

Do you use one of the Slack alternatives mentioned here, or do you think Slack is the real deal? Did we forget a competitor? Please let us know in the comments, and thank you for reading. 

The True Value of Legacy Systems Modernization for Businesses

$
0
0

Feed: Featured Blog Posts – Data Science Central.
Author: Roman Chuprina.

To stay relevant businesses should always take the path of innovation: what was effective a few years ago today just might not be that effective. In this article, I would like to talk about Legacy Systems Modernization and why should you do anything you can to keep your processes up-to-date, with the specific methods and approaches.

Introduction

Technology is progressing fast, with more groundbreaking use cases appearing that have involved Artificial Intelligence, Machine Learning, the Internet of Things, and Big Data solutions in some capacity. The term “Industry 4.0” was coined in 2011 — just imagine the change in the state of technology in the last decade! Who could imagine the necessity to migrate to the cloud or install smart sensors to improve predictive analytics capabilities?

We are on the verge of a technological revolution, and now it is crucial to implement the latest technologies in your business to stay ahead of the competition. In this article, I would like to dive deep into the subject of legacy systems modernization and what instant value it can bring to your business. The interest in legacy modernization has been stable over the last five years and it peaked in February 2020, so this topic is definitely hot for further discussion.

The Definition of a Legacy System

It’s not so easy to give an exact explanation of what a “legacy” system is, because it depends on many factors. In the real world, the majority of companies combine new technology with existing infrastructure; they adopt cutting-edge software for the old systems. Some companies are replacing their infrastructure step by step, keeping their enterprise running on old technology in the bigger picture.

But still, there are plenty of those who are still running an obsolete infrastructure. In fact, you can find some over-the-top cases. How about the IRS that in 2020 is still running on a concept that was introduced in 1959? This system has become an antique, but it somehow continues to maintain almost 1 billion records. Dave Powner, GAO’s director, expressed his concerns, acknowledging that this is too risky for the USA’s government to rely on such an outdated system constantly putting the task-fulfilling process at risk. This case is proving one important thing: while legacy software could run for decades, it becomes a weak point of a company.

While legacy is often associated with the term old, in regard to software, it’s not always defined solely by its age. Software could easily be dubbed “legacy” due to a struggle to support it or its failure to meet the demands of an organization.

What is a Legacy System?

So, in IT you can call a system a legacy system if it’s way past its prime, but still in use. It could be an old piece of computer hardware, a computer program that is clearly too old, or maybe a process or a set of processes that could be replaced by much more effective ones in 2020. In some cases, it’s a combination of everything mentioned above!

A legacy system is an information system that may be based on obsolete technologies, but it is irreplaceable at the moment. Replacing such systems with new cutting-edge technology is a very complex challenge, so companies must ensure the compatibility of the new technologies with the old systems and data formats that are running at the moment.

Why does that happen? Well, it is the “If it ain’t broke, don’t fix it” scenario. Unfortunately, the IRS is far from the only example of such systems in major federal institutions. The US GAO made a list of systems that are up to 50 years old, have survived for decades by being adjusted from time to time, and provide specific functions to the organizations, but eventually need to be replaced due to some major support issues and security risks.Of course, there are some valid excuses to maintain operations just a way they are for years. For example, a software or hardware vendor goes bankrupt — making it next to impossible to change operations. The experts who set up those systems could have left their jobs and not left any applicable instructions. It could be simply too costly for an organization to move to a newer system, and as a result, the organization must work with the old one for the time being.

Examples of Legacy Systems

Probably the biggest problem of legacy systems is that they are expensive to maintain and parts become hard to find as the years go by. As long as there are voicemail systems from the ‘90s, manufacturing processes that are controlled by a computer running on MS-DOS, electronic microscopes that are running on Windows 95 computers, or sales terminals running on Intel 286s, there are problems businesses with those types of legacy systems. Luckily, there is a solution to this, and we will talk about it right now.

What is Legacy System Modernization?

Simply put, it is upgrading or replacing some of your IT assets to better align with your business objectives. Every business should strive to bring innovation into their processes. To achieve that goal, proper technology, fast software applications, swift connectivity, and modern platforms are required. Most old IT systems fail to deliver that, and that’s precisely why they have to be replaced.

Legacy system modernization is much more than simply updating software. Let’s get clear with the definitions here:

  • The programs your organization has operated on for a certain period of time, but are outdated is Legacy Software.
  • Determining, upgrading, or replacing obsolete systems, processes, or software — entirely or partially — is Legacy System Modernization.
  • If you decide to replace the entire platform on which your system is operating, that is Replatforming.

There is definitely a huge difference between Legacy System Modernization and Replatforming. The extent to which you need to change your operations solely depends on your situation. Complete replacement is not an option in many cases. Thus, you need to clearly understand the problem and how you can solve it without additional losses. Let’s start to figure out what you should do in your case by determining why you need Legacy System Modernization to begin with.

Top 5 Reasons to Update Your Legacy Infrastructure Right Now

Leaving working machinery or programs alone and letting them do the job seems like a no-brainer. However, the times are changing as well as the situation on the market. The following list is intended to prove why you need to let the past go and improve your organization by whatever means necessary and as soon as possible.

The Real Cost of Outdated Technologies

In theory, your operations may seem to run smoothly, you are getting impeccable results, and everything may seem to be fine. So, why bother changing the old pieces of equipment and software? Because there is something that is always linked to Legacy Systems — this is called “the lost opportunity costs.” How you can calculate this? It is quite simple — when your business is coming up short on taking advantage of the innovations and your competitors cash in on the opportunities, every cent they earn from this could be considered your loss.

The truth is the companies that rely on modernization are getting the chance to reduce production costs up to 500%, depending on the way it is achieved, of course. Usually, companies waste over half of their IT budget on supporting old systems, dealing with archaic pieces of code, and managing support tickets. If you haven’t transferred your data centers to the cloud yet, you are probably still losing money on maintaining data centers, not to mention the loss of opportunities for scalability and ease of detecting problems in the system. This is especially important for small businesses — because the longer you use old systems, the more of your budget is invested in keeping it alive, taking you to the point where maintenance will be more expensive than an actual upgrade.

You can’t measure the hidden, but there are quite obvious factors like the happiness of your employees as well as the image of your organization, which is closely connected to customer loyalty and their satisfaction level. There is some research that claims over 90% of clients will more likely switch to another company instead of continuing to trust one with technologies way past their prime. You don’t want to become part of that statistic!

Security Issues

The risks in this area are fairly obvious, but we can’t stress them enough —legacy systems just can’t meet modern security standards. There have been plenty of reports on malware attacks and data breaches, and those situations could be easily avoided if companies would get rid of their old equipment. It is impossible to rely on the systems from the early 2000s to detect viruses and hacker attacks. Just a couple of years could make a huge difference here.

The truth is when manufacturers cut off their support of a system, that makes it vulnerable to the latest threats because regular patches and updates are basically what is keeping your system alive and well. Without the vendor’s support, your system becomes an easy target for criminals, and it is only a matter of time before your whole organization could be in danger.

Integration and Compatibility

You can put complete modernization on hold, but there is always a need to add something new to your processes; it may be something minor, but here is where legacy turns into a bottleneck.

Let’s say your clients are well aware of Machine Learning in Banking innovations and they notice that some of your competitors have already switched to chatbots running on Artificial Intelligence for basic inquiries, requiring human experts only when necessary. You make a decision to get rid of the call center and switch to AI-powered chats — but legacy systems tie you up, making it impossible to switch quickly without breaking up the process.

Of, course, such integration is possible, but it requires additional time and effort, a large amount of custom coding, and buying new equipment to make it work. It wouldn’t be such a hassle if your technologies have been already updated. Additionally, no one really knows what the next big thing in technology will be, so that is a solid reason to modernize your operations as much as you can.

Rapidly Increasing Maintenance Costs

Not only do legacy systems fail to meet your business strategy goals, but they also become more expensive to support every year. The percentage could be as high as 85% of your IT budget on partial upgrades, updates, and training for your employees to handle old technology.

The numbers speak for themselves. As reported by Microsoft, the cost of a PC running on Windows 10 is approximately $168 per year, while if you stick to Windows XP it could be as high as $780 per year — and that’s just for one unit! You can reasonably expect that over $600 price gap will only become bigger with time.

But it is not only the cost of the maintenance that is a problem, but also the frequency of breakdowns and the time required to get things to work again. Robotic Process Automation that is driven by Artificial Intelligence takes over routine and repetitive tasks from humans and connects your software solutions into one cohesive ecosystem. If something goes wrong, an integrated RPA will detect the problem instantly, while a legacy system simply can’t do this quickly and efficiently. Businesses are losing almost $400,000 for every minute of downtime worldwide, so every moment counts!

Limits for the Overall Efficiency of the Business

Years ago, when your business was set up (or since the date of the last modernization), everything seemed to be working efficiently. But is it now? What is the reason for putting the future of your company in danger by settling with the old? Your business should be flexible in order to adjust your business model, scale your processes, and adapt to the constantly changing market.

The first important block to getting maximum efficiency is a lack of agility. It is a common trait among legacy systems, and they just can’t keep up with the speed of the innovation and changes in industries. Agile methodologies are able to improve the speed of IT processes by 50%, as reported by McKinsey.

The second obstacle is the mobile functionality that your business is failing to deliver. According to a survey by Red Hat, almost 90% of businesses have already implemented mobile functionality into their processes.

It makes perfect sense because if your business is inaccessible from mobile devices, you are not just falling short in keeping up with your competitors, but also your overall performance is limited. To improve performance and achieve additional flexibility is super important in order to migrate your operations to the cloud and get the full advantages of mobile technologies.

This is a demo that shows how a legacy web app running on Windows could be modernized and replaced by Google Cloud Platform:

The Benefits of Legacy System Modernization

There are some tangible risks regarding old pieces of software and machinery; however, some companies are still hesitating to launch the modernization process. Unfortunately, the vast majority of businesses will only turn to innovation in cases of an emergency or the threat of downtime. Even before the technological shift, the mindset of business leaders should have been changed, and here are some reasons in favor of legacy modernization.

Getting an advantage over competitors

While your competitors are still hesitating, you can start legacy application modernization and cash in on current as well as potential business opportunities. With the modern technology stack, your company will have more flexibility to launch new products and services that have a real chance to succeed in your marketplace.

Improving customer support

Paper-based legacy infrastructure is not just a real hassle for companies, costing them tons of money, but also a big disadvantage in a customer support area. Turning your business digital will enable you to save time and take advantage of simpler compliance, improved tracking, and sophisticated encryption algorithms, which will improve your brand image and customer satisfaction.

Leveraging Artificial Intelligence, Machine Learning, and Big Data

“Big Data” means literally “Big Opportunity” in 2020. The ability to connect all possible information from multiple data points is a crucial factor in the efficiency of almost every business. Legacy transformation will enable you to get the most value out of this concept, especially if you take the power of Artificial Intelligence into account. This term seems to be everywhere right now, but there is real substance behind this hype. Artificial Intelligence along with its subdivision Machine Learning are introducing once-inconceivable opportunities for data analytics, including predictive and preventive analytics. Just take a look at how Artificial Intelligence is changing Finance — such growth and innovation would be impossible if those financial institutions were running legacy platforms.

Performance and revenue boost

Spending money on technology definitely makes sense in terms of efficiency, let’s look at cloud computing for instance. According to IBM, updating your legacy system will improve the productivity of your developers by almost 50%, thanks to modern tools and much more effective cloud technology. After the digital transformation, you can satisfy the needs of each department, providing exactly what is needed (e.g. more storage space or processing speed), because modern systems are making progress in flexibility as compared to the oldies.

https://spd.group/wp-content/uploads/2020/03/Legacy-Systems-Moderni… 300w” data-srcset=”” sizes=”(max-width: 576px) 100vw, 576px” />

Future-Proof Enterprise

Two years ago, the United States government invested only 20% of its IT budget on modernization, leaving 80% to keep legacy systems alive. How about that growth model? Like it or not, you are constantly investing in your business and it is your choice where to put your funds. You can choose data migration to the cloud and later adopt a Machine Learning algorithm that will help to extract the value out of Big Data or you can waste precious resources on an uphill battle with trying to innovate your legacy system. The ever-changing market demands action, and the key to staying relevant is constant improvement. Let’s examine how you can achieve that!

Legacy Systems Modernization Approaches

So, you have decided to get into modernizing your legacy system; that means you are heading toward big changes in your business processes. This is actually a sort of crossroads and you have basically two ways to go about it: starting from scratch with a revolutionary method or following a more subtle but no less effective evolutionary approach. They both have their advantages and disadvantages, and you can pick the best one for you.

The revolutionary method

Also known as the “rebuild and replace” approach. This one involves taking out the legacy system for good and replacing it with a new one. Sounds like too much? Well, because it is. However, there are cases when it is necessary. For example, when you realize that some heavy damage is unavoidable, like potential security breaches when your system just can’t deal with hacker attacks anymore. There are other good reasons to take the rebuilding route. Perhaps your system can no longer provide a solution for your business goals; since that type of legacy system is useless, replacing it makes the most sense.

The evolutionary method

This is the opposite of radical disruption and a safer way for companies to embrace innovation. It includes modernization divided by stages, which keeps your business running without any downtime or serious risks. But when this approach is used for a long period of time, it could turn into fixing separate problems rather than eliminating the root cause — with the speed of technological progress, this is inevitable.

Businesses that choose this approach have been experiencing some difficulty making new systems work with existing ones. The biggest challenges are simultaneously making them compatible with each other as well as secure.

To pick the best way to go, you need to determine the exact bottlenecks your legacy system is causing and how effectively each approach will eliminate them. Of course, there are other ways to classify it and they could be called different names, but for now, we will stick with the following approaches:

  • System Migration and Enhancements
  • Technology Correction and Growth
  • Total Software Reengineering

The easiest and the least disruptive of the three is the approach where you migrate your system or parts of your system to the cloud while adding some minor adjustments. This is quite popular due to its non-disruptive nature; this approach could include overall optimization and various upgrades. Of course, it has some vulnerabilities — the most obvious being the fact that business processes generally stay the same, and you can’t change the core architecture using this method.

In the case when the technology your business operates is fresh doesn’t limit the potential for the future, the modernization process could simply be some corrections and enhancements when they are needed. Once again, keeping the main business processes the same, this legacy system modernization approach could involve improving the architecture, making minor adjustments, or maybe code refactoring. After the upgrade, you can include additional features, some new modules, or third-party integrations. You can divide this approach into two real-world scenarios: improve existing systems and the duct tape approach. While the first one means fixing what is already operating well, the other focuses on introducing additional applications that will connect with the legacy system to provide the necessary functionality.

When we are talking about Total Software Reengineering, we are talking about a major change. It starts with identifying what features are vital to your business and what could be removed because they don’t matter anyway. When the list of features is clear and the development team understands what needs to be done, the new modern system is built from scratch. All required features are in place, but now this system is providing more impressive performance, is stacked with modern technologies, and is scalable and future-proof!

The Importance of Data Unification

Modern businesses no longer have a problem with the availability of the information; there are enormous amounts of it as well as the tools to collect and analyze it. The real question is how to manage it and most importantly, how to extract valuable and actionable insights. Now that you can learn everything about the online activity of your customers, their preferences, age, or demographic, making sense of those parameters can just make things more complicated instead of giving an advantage. So, what do we do now with this burden of information, called the “data lake”, and how do we make sense of it?

The definition of data unification

The data unification process means connecting and merging information of different types from multiple sources to benefit your business strategy. To achieve this goal, the information should be exported from a variety of data sources, sorted, and any duplications should be removed by both human experts and advanced Machine Learning algorithms.

The programs with the instructions for Artificial Intelligence to gather, match, and unify data are created by data scientist experts. Developing the code to complete this task could take months. But when that is done, automated systems can convert all streams of data into one unified data set.

Why is it a challenge?

The main factor here is the amount of data. Companies that are unifying thousands of data points from a couple of sources could handle it a bit more easily. But what about the giants? It took GE took years to successfully complete this task for procurement systems, because it meant unifying data from 80 separate systems. But as a result, the corporation is saving $1 billion a year! This impressive save is achieved only by GE improving the awareness of its own processes inside the organization. The interest in data unification in different industries is rapidly growing, and it will increase in the coming years as the opportunities to obtain more information about the processes inside of organizations increase.

Platform Development and Data Migration Experience from SPD Group

One of the biggest challenges for businesses is Mergers & Acquisitions (M&A) during Digital Transformation process. To make the platform consolidation process easier, it is good to have an Integrated and Unified Digital Platform that helps remove the complexity from business processes, making your processes more agile and letting you focus on improving customer experience — all of which will ultimately increase your revenue.

SPD Group provides custom, high-scaled, Enterprise-grade Consolidated Platform Development or Re-engineering; Data Migrations and Reconciliation with advanced and flexible reporting BI System Development; as well as implements technologies like Machine Learning and the Internet of Things. These solutions will ultimately solve the problem of legacy systems and will make sense of all fragmented data in your business. You will receive affordable and manageable standardized business execution that will lead to the optimization of infrastructure and maintenance costs optimization along with the reduction of operational and capital expenses.

Summary

Is Legacy Systems Transformation a “big deal”?

It is a huge deal, because over half of all the enterprises in the entire world will digitize their processes in the next three years to increase their revenue by 14% and productivity by approximately 40%.

Is it suitable for my industry?

Yes, it is suitable for any industry of any size that uses IT technologies: from software for POS terminals and PCs running on Windows to massive and sophisticated systems operating on custom software.

What are the reasons to implement Legacy Systems Transformation?

You will stop wasting an enormous amount of money on supporting old and ineffective systems, increase the level of security and compatibility of your devices, cut costs on the overall maintenance of your business, and eliminate bottlenecks in your company’s growth potential.

What are the benefits?

An advantage over competitors that are still relying on legacy systems, better customer support, increased performance and revenue, and a “future-proof” enterprise that can fully utilize innovations like Artificial Intelligence, Machine Learning, and Big Data.

What are the approaches to do this?

There are essentially two ways for Legacy System Transformation — revolutionary that disrupts your processes to bring radical change or evolutionary, a subtler and less risky approach. You can choose the one that will fit your business the best!

Conclusion

Whatever approach or scale of transformation you choose, it will inevitably take time and effort, but the actual value is definitely worth it. Digital transformation is set to change the global economy — over 50% of the world’s enterprises will digitize their processes by the year 2023, according to the IDC. To survive in the modern world, businesses must embrace transformation as a continuous process rather than just one or a few separate projects. SPD Group is here to take off with you on the journey of digital transformation, feel free to contact us any time!

Further Reading

  1. Modernization of Legacy IT Systems – https://ocio-website-files.s3-us-west-2.amazonaws.com/Modernization…
  2. Legacy Enterprise Systems Modernization: Five Ways of Responding to Market Forces – https://www.cognizant.com/whitepapers/legacy-enterprise-systems-mod…
  3. Succesful Legacy Systems Modernization for the Insurance Industry – https://www.informatica.com/content/dam/informatica-com/en/collater…

Originally posted here


An Introduction to Teradata’s R and Python Package Bundles for Vantage Table Operators

$
0
0

Feed: Teradata Blog.

In part 1 of this blog series, we introduced the two approaches that R and Python programmers can use to leverage the Teradata Vantage™ platform.  In part 2, we focused on the client-side languages and packages for R and Python – tdplyr and teradataml. In this third and final blog, we describe the server-side options for executing R and Python directly in Vantage.

Teradata has always been on the bleeding edge of exploiting its shared nothing massively parallel platform (MPP) architecture for the purpose of scaling advanced analytics. In this regard, the Table Operators (TOs) database construct, that was developed as part of the Teradata SAS partnership, allowed SAS PROC’s and data step language to operate directly within the Teradata Database years ago. Today, TOs allow a similar processing capability in Vantage for R and Python.

As a reminder from part 1, a wide variety of use cases can be addressed with TOs. To explain them all, we introduced the following processing nomenclature:

  1. Row-independent processing (RI) – The analytic result depends only on the input from individual data rows on a single AMP – e.g. model scoring.
  2. Partition-independent processing (PI) – The analytic result depends on the input from individual data partitions on a single AMP – e.g. simultaneous model building.
  3. System-wide processing – The analytic result is based upon the entire input table which is evenly spread across every AMP in the system – e.g. single model building on the corpus.

How Vantage specifically handles each of these processing paradigms is described in subsequent sections. First, let’s talk about the new R and Python package bundles for Vantage! 

Vantage R and Python Package Bundles

R and Python programmers are used to having ANY mathematical, statistical or scientific package at their fingertips, installing them in a few clicks of the mouse, or a single line of code. However, in production MPP environments, each package needs to be inspected for security vulnerabilities, and potential licensing issues prior to deployment. Then each package needs to be installed and validated on every node within the MPP platform. This unwieldy process often results in major conflicts between the IT organization, and the data science community they need to serve.

In the recent release of Vantage, Teradata is helping to resolve that conflict by offering R and Python Distribution packages. Each language package bundle includes an Interpreter package and an Add-Ons package. In their initial release, the Add-Ons packages are collections of some 400 of the most utilized R packages and over 300 of the most utilized Python packages. These package bundles will evolve and be updated multiple times a year depending upon customer requests and will include a change control for an easy Teradata Customer or Managed Service installation.

Vantage SCRIPT Table Operator for R and Python

The first table operator we will discuss is a generic language processor known as the SCRIPT table operator. For an R or Python script to be processed in Vantage through SCRIPT, there are several simple rules that must be followed. First, the script must be “installed” or registered to the database. Vantage provides a very simple one-line SQL command that performs this registration. Second, the R or Python script must read data from Vantage through the Standard Input Stream, commonly referred to as stdin*, and write back through the Standard Output Stream or stdout*. For the first processing model described above (RI), these are the only two rules. 

The second processing model (PI) requires an additional rule be followed. As these programs are executed on every AMP independently, Vantage provides a partitioning mechanism which guarantees at runtime that distinct data partitions will land on distinct AMP’s. By using a PARTITION BY clause when writing the SQL statement to source the data for use within the script, each AMP will simultaneously execute the installed script on its partition of data.

For system-wide style processing, the data scientist must construct a master process to combine and appropriately process the partial results returned from every AMP process. This can be done either by using a MapReduce style that nests multiple calls to the SCRIPT table operator or by embedding calls to the SCRIPT table operator within a C++ or Java external stored procedure (XSP). In either case, the results are aggregated across all AMPs and processed further to produce a meaningful final answer.

Get a step-by-step demonstration on how to use the Python and the SCRIPT table operator in this short video, Using R and Python with Vantage, Part 5 – Python and Table Operators.

Vantage ExecR Table Operator for R

As the name indicates, the ExecR table operator is specific to R programs. It forces R to run in a special protected mode server for code licensed under the General Public License (GPL), and has the same processing considerations for RI, PI and system wide analytics as described for SCRIPT.

One difference between SCRIPT and ExecR is that ExecR does not require a script file installation or registration process. Instead the R code is passed directly within the SQL statement calling ExecR. This code comes in two pieces – the “contract” which specifies the result schema returned by the R script, and the R code itself, called the “operator.” Additionally, while SCRIPT is limited to a single input – referred to as an ON clause – ExecR can have up to 16. Finally, I/O is not limited to STDIN and STDOUT as with SCRIPT; instead ExecR supports the FNC API, which is used in standard C, C++ or Java User Defined Functions to read and write data and read metadata from the Vantage data dictionary. The R FNC API’s are defined in the “tdr” add-on provided by the teradata-udfgpl package, available from Teradata At Your Service.

Get a step-by-step demonstration on how to use R with the SCRIPT and ExecR table operators in this short video, Using R and Python with Vantage, Part 4 – R and Table Operators

Scaling Your Data Science Process

With Teradata Vantage, you can use R and Python to take advantage of its MPP for performance and scalability. With faster analytic processing in Vantage, the highly iterative tasks required of the data scientist are accomplished in minutes or hours, rather than days. If you are on a previous version of Teradata, and curious about upgrading to Vantage, contact us today.

* The standard input (stdin) and standard output (stdout) streams are preconnected input and output communication channels between a computer program and its environment when it begins execution.
 

(Author):

Tim Miller

Tim Miller has been in a wide variety of R&D roles at Teradata over his 30+ year career. He has been involved in all aspects of enterprise systems software development, from software architecture and design; to system test and quality assurance. Tim has developed software in domains ranging from transaction processing to decision support, with the last 20 years dedicated to predictive analytics. He is one of two principals in the development of the first commercial in-database data mining system, Teradata Warehouse Miner. As a member of Teradata’s Partner Integration Lab, he consulted with Teradata’s advanced analytics ISV partners, including SAS, IBM SPSS, RStudio and Dataiku, to integrate and optimize their products with Teradata’s platform family. He spent several years with Teradata’s Data Science Practice, working closely with customers to optimize their analytic environments. Today, Tim is a Sr. Technologist in Teradata’s Technology Innovation Office, focused on the Vantage platform.

View all posts by Tim Miller

I feel the need to stream: the impact of continuous intelligence

$
0
0

Feed: IBM Big Data & Analytics Hub – All Content
;
Author: pearl-chen
;

Staying at the forefront of digital transformation means embracing constant change. It’s about staying nimble to customer demands, tapping into the pulse of a shifting market, and taking actions on insights as they’re developed. All of this can be made possible through continuous intelligence (CI).

Grounded in real-time analytics, CI allows companies to make informed, of-the-moment decisions as events occur. Integrating historical and streaming data, CI delivers a more complete picture with insights into not only what’s happening now, but why. Unlike classic business intelligence, it incorporates machine learning and AI at the core to form predictive analysis and automate decision support. When infused into business processes across hybrid and multicloud environments, CI can help companies streamline operations, detect and fix problems before they emerge, save resources, spike ROI, and ultimately improve the bottom line. In fact, the case for continuous intelligence is so strong that Gartner estimates more than half of major new business systems will incorporate CI by 2022.

IBM has worked with clients across a wide range of industries to deliver impactful business results with CI. From improving disaster relief to creating smart Japanese vending machines, these industry uses cases are a testament to CI’s vast potential to transform and innovate. Hear stories from Mike Beddow and Cathy Reese, two sales leaders at IBM’s Global Business Services, in conversation with RTInsights.com:

Continuous intelligence in the public sector

When natural disasters strike, one of the top priorities for the government is to safely and quickly deploy emergency resources. Beddow takes us through the true story of a botched effort for disaster relief by a local state government and how that incident inspired a new wave of predictive analytics to aid emergency resource allocation. Cloud Pak for Data, IBM’s leading data and AI platform, helps the state determine, for example, whether a certain district will need more snowplows than others and reallocate in real-time as necessary.

Continuous intelligence in the transportation, utility, and retail industries

“Everyone’s looking for the next new business model,” says Reese, and CI plays a crucial role in helping companies innovate. In the transportation industry, shipping trucks can now track the types of traffic that drive by and open up new ad revenue streams from sponsors who seek hyper-targeted advertising at the side of the trucks. In retail, Japanese vending machines can now collect data from foot traffic, weather, time of day and more to determine what kind of items to offer—such as cold drinks on a hot day, warm soup on a cold day, etc. Utility companies can adjust their vegetation management strategies by detecting where fire is most likely to occur, drawing from historical and real-time data such as wind speed and humidity.

Continuous intelligence in healthcare

When sepsis—the body’s life-threatening reaction to infection—occurs in a patient, detection often happens too late. Beddow works with clients that are using CI to provide early detection of sepsis and outcome-based care. This is one example of how CI can help hospitals shift away from a fee-for-service model (i.e. “how many patients are seen”) to one that can predict real-time outcomes based on individualized treatments (i.e. “which prescriptions actually led to faster recovery times?”).

Continuous intelligence in the insurance industry

CI is helping an Italian insurance company innovate with telematics (collection and/or transmission of data from a vehicle at rest or in motion). By matching streaming telematics data with claims data, the company can process claims much more quickly. It can also detect real-time events, such as accidents or fraud, through IBM Cloud Pak for Data’s integrated platform that brings together siloed sources of historical, streaming, customer service, and policy data.

Continuous intelligence in the chemical industry

Data around chemical defects is not the kind that can wait to be batched in the next 24 hours. It needs to be spotted and fixed right away, and Reese is working with one company to do just that. By using IBM Cloud Pak for Data to build a flexible information architecture, the company can add on different use cases as needed to achieve quick wins and alert clients who may be impacted by potentially hazardous chemical defects.

To learn more about how IBM Cloud Pak for Data supports continuous intelligence, read our ebook Successful Continuous Intelligence Across Various Industries or visit our website.

Accelerate your journey to AI.

Capabilities to Enable the Next Wave of Digital Transformation

$
0
0

Feed: Actian.
Author: Sampa Choudhuri.

Digital transformation is a journey, not a destination.  Over the past few years, companies of all sizes, across industries have embarked on digital transformation journeys to modernize the way they leverage technology within their organizations.

Business processes have been re-defined and deeply integrated with IT systems, applications, and automation capabilities to create highly efficient operations that maximize the value return from both human and technology resources.

Most companies have embraced digital transformation and are beginning to reap the benefits in terms of increased productivity and process capacity.  But now what?  The initial “transformation” project is wrapping up, and IT leaders are looking ahead to the next wave of digital transformation capabilities that their companies will need to embrace.

The next step in the transformation journey is a shift towards real-time data-driven decision making.   This makes sense – you created a technology-enabled business process that is now churning out continuous streams of data, and it is time to start using that data to drive further optimization.  Moving your operations and decision making to real-time will require a new set of data management capabilities – this is what will fuel the next wave of digital transformation.

Real-Time Analytics will Enable the Next Wave of Digital Transformation

In a digitally transformed business process, things happen quickly, and things can change rapidly.  Business agility, the ability to identify and rapidly respond to events, threats, and opportunities, is essential for modern businesses.

The first step of business agility is recognizing as soon as something changes in the environment.  Any time-delay is lost opportunity and increased risk.  That is why companies are investing in real-time analytics capabilities – to efficiently channel data signals from digital business processes to delivering quality data to operational decision-makers in the form of analytics and dashboards.

The instrumentation to collect the data are already there (you installed them as a part of your initial transformation. Now the focus is to get the data from the source systems into the hands of people who can make decisions faster.

Critical Capabilities that Enable Real-Time Analytics

If you take a look at the process for transporting operational data signals from source systems to data consumers and combine it with the transformation process to convert raw data into actionable information insights, three main underpinning capabilities are required.

  1. A flexible integration solution to manage the connections and orchestrate the movement of data.
  2. A cloud data warehouse capable of handling large scale data analytics in real-time.
  3. Reporting tools to present information to decision-makers in an easily consumable format.

Of these capabilities, the third one (reporting tools) is probably good enough and doesn’t require attention right now.  Why? Because there are a lot of good reporting and analytics tools on the market, and you probably already have one that is good enough.

Most companies have more than one of them already, users are happy with them, and they are not yet being used to their full potential.  This is because the reporting tools are being constrained by the data being made available to them. What this means is the areas that need the most improvement are your integration and data processing capabilities.

Integration and Data Processing Capabilities for Real-Time Data

If you want decision-makers to have immediate access to real-time data, there are two problems you’ll need to solve.  First is the transport problem – your source data is spread across your organization in a diverse set of devices and applications that may not be connected well and likely have different data formats.

You need an integration platform to connect all the systems and components in your IT environment so you can effectively aggregate streaming data into a unified enterprise data set for analytics.  That then leads to the second problem – digitally transformed business processes produce a lot of data.

You need a data processing capability (with storage and compute) that can handle the massive volume of data and process it quickly and efficiently while at the same time fitting into your IT budget.

Actian is an industry leader in modern data management systems.  Actian’s connected data warehouse solutions combine the robust integration capabilities of DataConnect with cloud-scale analytics, storage decision-makers, and compute on the Avalanche platform.

Together Actian provides the core capabilities that you will need to power the next wave of digital transformation for your business and achieve the vision or real-time decision making.

To learn more, visit www.actian.com/avalanche.

Hazelcast Jet 4.0 is Released!

$
0
0

Feed: Blog – Hazelcast.
Author: Can Gencer.

Hazelcast Jet 4.0 is Released!

We’re happy to introduce Hazelcast Jet 4.0 and its new features. This release was a significant effort and featured 230 PRs merged which makes it one of our biggest releases in terms of new features.

Distributed Transactions

Jet previously had first-class support for fault tolerance through implementation of the Chandy-Lamport distributed snapshotting algorithm, which requires participation from the whole pipeline, including sources and sinks. Previously, the at-least-once and exactly-once processing guarantees were only limited to replayable sources such as Kafka. Jet 4.0 comes with a full two-phase commit (2PC) implementation, which makes it possible to have end-to-end exactly-once processing with acknowledgment-based sources such as JMS. Jet is now able to work with transactional sinks to avoid duplicate writes, and this version adds transactional file and Kafka sinks, with transactional JMS and JDBC sinks utilizing XA transactions coming in the next release.

We will have additional posts about this topic in the future detailing the mechanism and the results of our tests with 2PC for various message brokers and databases.

Python User-Defined Functions

Python is a popular language with a massive ecosystem of libraries and has especially become popular in the domain of data processing and machine learning. Jet itself is a data processing framework for both streams and batches of data, but the API for defining the pipeline itself was previously limited to Java and Java functions only.

In this version, we have added a native way to execute Python code within a Jet pipeline. Jet can now spawn separate Python processes on each node that communicate back using gRPC. The processes are fully managed by Jet and can make use of techniques such as smart batching of events.

The user defines a mapping stage which takes an input item and transforms it using a supplied Python function. The function can make use of libraries such as scikit, numpy and others, making it possible to use Jet for deploying ML models in production. For example, given this pipeline:

Pipeline p = Pipeline.create();
p.readFrom(TestSources.itemStream(10, (ts, seq) -> bigRandomNumberAsString()))
 .withoutTimestamps()
 .apply(mapUsingPython(new PythonServiceConfig()
 .setBaseDir(baseDir)
 .setHandlerModule("take_sqrt")))
 .writeTo(Sinks.observable(RESULTS));

The user only has to supply the following Python function:

import numpy as np

def transform_list(input_list):
"""
Uses NumPy to transform a list of numbers into a list of their square
roots.
"""
  num_list = [float(it) for it in input_list]
  sqrt_list = np.sqrt(num_list)
  return [str(it) for it in sqrt_list]

For a more in-depth discussion on this topic, I recommend viewing Jet Core Engineer Marko Topolnik’s presentation, Deploying ML Models at Scale.

Observables

When you submit a Jet pipeline, it typically reads the data from a source and writes to a sink (such as a IMap). When the submitter of the pipeline wants to read the results, the sink must be read outside of the pipeline, which is not very convenient.

In Jet 4.0, a new sink type called Observable is added, which can be used to publish messages directly to the caller. It utilizes a Hazelcast Ringbuffer as the underlying data store, which allows the decoupling of the producer and consumer.

Observable o = jet.newObservable();
o.addObserver(event -> System.out.println(event));
p.readFrom(TestSources.itemStream(10))
 .withoutTimestamps()
 .writeTo(Sinks.observable(o));
jet.newJob(o).join();

The Observable can also be used to notify you of a job’s completion and any errors that may occur during processing.

Over the last few releases we’ve been improving the metrics support in Jet, such as being able to get metrics directly from running or completed jobs through the use of Job.getMetrics(). In this release, we’ve made it possible to also add your custom metrics into a pipeline through the use of a simple API:

p.readFrom(TestSources.itemStream(10))
 .withoutTimestamps()
 .map(event -> {
    if (event.sequence % 2 == 0) {
        Metrics.metrics("numEvens").increment();
    }
    return event;
 }).writeTo(Sinks.logger());

These custom metrics will then be available as part of Job.getMetrics() or through JMX along with the rest of the metrics.

Debezium, Kafka Connect and Twitter Connectors

As part of Jet 4.0, we’re also releasing three new connectors:

Debezium

Debezium is a Change Data Capture (CDC) platform and the new Debezium connector for Jet allows you to stream changes directly from databases, such as MySQL and PostgreSQL, without requiring any other dependencies.

Although Debezium typically requires the use of Kafka and Kafka Connect, the native Jet integration means you can directly stream changes without having to use Kafka. The integration also supports fault-tolerance so that when a Jet job is scaled up or down, old changes do not need to be replayed.

This makes it suitable to build an end-to-end solution where, for example, an in-memory cache supported by IMap is always kept up to date with the latest changes in the database.

Configuration configuration = Configuration.create()
 .with("name", "mysql-inventory-connector")
 .with("connector.class", "io.debezium.connector.mysql.MySqlConnector")
 /* begin connector properties */
 .with("database.hostname", mysql.getContainerIpAddress())
 .with("database.port", mysql.getMappedPort(MYSQL_PORT))
 .with("database.user", "debezium")
 .with("database.password", "dbz")
 .with("database.server.id", "184054")
 .with("database.server.name", "dbserver1")
 .with("database.whitelist", "inventory")
 .with("database.history.hazelcast.list.name", "test")
 .build();

Pipeline p = Pipeline.create();
p.readFrom(DebeziumSources.cdc(configuration))
 .withoutTimestamps()
 .map(record -> Values.convertToString(record.valueSchema(), record.value()))
 .writeTo(Sinks.logger());

The Debezium connector is currently available in the hazelcast-jet-contrib repository, along with a demo application.

Kafka Connect

The Kafka Connect source allows you to use any existing Kafka Connect source natively with Jet, without requiring the presence of a Kafka Cluster. The records will be streamed as Jet events instead, which can be processed further with the full support for fault-tolerance and replaying. A complete list of connectors can is available through the Confluent Hub.

Twitter

We’ve also released a simple Twitter source that uses the Twitter client to process a stream of tweets.

Properties credentials = new Properties();
properties.setProperty("consumerKey", "???"); // OAuth1 Consumer Key
properties.setProperty("consumerSecret", "???"); // OAuth1 Consumer Secret
properties.setProperty("token", "???"); // OAuth1 Token
properties.setProperty("tokenSecret", "???"); // OAuth1 Token Secret
List terms = Arrays.asList("term1", "term2");
StreamSource streamSource = TwitterSources.stream(credentials, 
    () -> new StatusesFilterEndpoint().trackTerms(terms)
);
Pipeline p = Pipeline.create();
p.readFrom(streamSource)
 .withoutTimestamps()
 .writeTo(Sinks.logger());

These connectors are currently under incubation and will be part of a future release.

Improved Jet Installation

We’ve also made many improvements to the Jet installation package. It has been cleaned up to reduce the size and now supports the following:

  • Default config format is now YAML and many of the common options are in the default configuration
  • A rolling file logger which writes to the log folder is now the default logger
  • Support for daemon mode through jet-start -d switch
  • Improved readme and a new “hello world” application which can be submitted right after installation
  • Improved JDK9+ support to avoid illegal import warnings

Hazelcast IMDG 4.0

Another change that’s worth noting is that Jet is now based on Hazelcast IMDG 4.0 – which in itself was a major release and brought many new features and technical improvements, including better performance, Intel Optane DC Support and encryption at rest.

Breaking Changes and Migration Guide

As part of 4.0, we’ve also done some house cleaning which moved things. All the changes are listed as part of the migration guide in the reference manual.

We are committed to backwards compatibility going forward and any interfaces or classes which are subject to change will be marked as @Beta or @EvolvingApi going forwards.

Wrapping Up

Hazelcast Jet 4.0 is a big release and we have many more exciting features in the pipeline (pun intended), including SQL support, extended support for 2PC, improved Serialization support, even more connectors, Kubernetes Operators and much more. We will also be aiming to make shorter, more frequent releases to bring new features to users much quicker.

The innovations bridging health sciences and business in 2020

$
0
0

Feed: Microsoft Dynamics 365 Blog.
Author: Alysa Taylor.

The decade’s first global health crisis has placed the spotlight on the need for healthcare technology that can prevent and solve the world’s critical health challenges. This last week, Microsoft shared progress on innovations helping to meet these objectives.

Today, we’re spotlighting intelligent health and business solutions from Microsoft Business Applications that empower health providers to help transform operations and deliver better patient experiences, better insights, and better care.

Healthcare organizations are leveraging Dynamics 365 and Microsoft Power Platform to improve both provider operations and patient outcomes. These customers are prime examples of our focus to enable tech intensity across healthcare, empowering organizations to develop their own digital capabilities that use data and AI to address challenges and tackle new opportunities.

Improving operational performance for healthcare nonprofits

Across healthcare, quality of care is increasingly dependent on synchronizing operations across staff to gain greater efficiencies and accelerate decision-making.

Partners In Health, a Boston-based social justice and health care nonprofit, serves impoverished communities in 10 countries, striving to bring modern medical science to those most in need. The team lacked a defined process to manage the more than 1,000 individual donors. Donor lists and reports were stored in various formats and places, and the aging customer relationship management system (CRM) provided limited insights into data stored in multiple siloed systems.

The team turned to Microsoft Power Platform, championed by one individual. In just one training session, Bella Chih-Ning, a manager on the Partners In Health Analytics and Applications team, felt empowered to create a Power App that let the gift officers manage many aspects of donations, and Microsoft Power BI reports to gain insights. As a result, Partners In Health has the tools needed to raise the funds needed to bring world-class health care to those most in need.

Read the full story about how Partners In Health transformed the gift review process with Microsoft Power Apps and Power BI.

Personalizing healthcare on a single member-engagement platform

Another way Dynamics 365 is helping to improve operational outcomes is by helping make health insurance more convenient, supportive, and personal. MVP Health Care is using Dynamics 365 and Microsoft Power Platform to improve quality of care while lowering costs for its members.

Like other healthcare payors, MVP Health Care strives to provide high value care and seamless coordination by monitoring and managing members with programs designed to capture early diagnoses, prevent complications, and drive better patient results. Fully understanding members’ needs, however, was challenged by a customer relationship management environment that was pieced together from multiple siloed data sources and technologies.

MVP Health Care chose Dynamics 365 to build a comprehensive, centralized, and fully integrated member-engagement platform with a single view into each of its 700,000 members. MVP Health Care has tied everything together to centralize data streams, streamline processes, scale elastically, and promote member value, giving them a holistic view that will ultimately improve the overall health and wellbeing of the populations they serve.

Empowering more effective care teams for children with autism

To meet patient needs, care teams need the ability to rapidly analyze and obtain insights from patient data so clinicians and patients can coordinate effectively on treatment plans.

Encore Support Services, a behavioral health provider servicing children with autism, witnessed first-hand the challenges applied behavior analysis (ABA) providers face when utilizing inadequate solutions. With as many as ten individuals on a care team for a single child, coordination beyond what was possible with current fragmented solutions was necessary. Cumbersome documentation systems needed to be done away with to minimize practitioner burnout.

Encore partnered with Chorus Software Solutions to lay the foundation for what would become AutismCare, the first and only Fast Healthcare Interoperability Resources (FHIR) compliant ABA solution. This cloud-based technology is built on Dynamics 365, Microsoft Power Platform, and Microsoft 365. The solution brings together previously siloed data to enable teams to coordinate care plans and patient data in real-time, empowering teams to deliver a more personalized, human experience to the autistic community at scalea big step to ensure patients and families get the support and care they deserve.

In addition to AutismCare, Encore Support Services has worked with Chorus to develop several other solutions leveraging the full gamut of Dynamics 365 applications, including Dynamics 365 Sales and Dynamics 365 Marketing as part of an end-to-end practice management solution that empowers care teams and streamlines operations.

According to Encore Support Services, behavioral health is just the start. The platform can be tailored to a range of solution areas that can benefit from the proven improvements in clinical quality and outcomes.

Learn more about Microsoft’s focus on healthcare

These stories are just a few examples of how Microsoft Business Applications are helping transform patient and provider experiences. I encourage you to read more about our healthcare initiatives below and stay tuned to our blog for updates in the near future.

The post The innovations bridging health sciences and business in 2020 appeared first on Dynamics 365 Blog.

Viewing all 965 articles
Browse latest View live