Quantcast
Channel: Streams – Cloud Data Architect
Viewing all 965 articles
Browse latest View live

AWS IoT Named “Best Consumer IoT Solution” at 2020 IoT World Awards

$
0
0

Feed: The Internet of Things on AWS – Official Blog.
Author: Hannah Nilsson.

At AWS, we build technology to help customers and partners like Bose, Vizio, LG, British Gas Centrica Connected HomeAyla, NXP, and more solve real world problems and unlock possibilities to create better business outcomes and new consumer experiences. Yesterday, IoT World named AWS IoT the “Best Consumer IoT Solution” for 2020. We are grateful to the IoT World team and panel of judges for this honor, and commend our ecosystem peers who were shortlisted. This award is an opportunity for us reflect on the journey we’ve forged with our customers and global ecosystem of world class partners who use AWS IoT services to build consumer application for use cases such as home automation, security and monitoring, home networking, energy management, and more.

These organizations rely on our technology to help accelerate time to market, innovate for better customer experience, reduce connection costs, manage IoT devices at scale, and deliver results to their top and bottom line. But the truth is, we also rely on them to ensure we are providing the market with the right solutions for building and managing great consumer IoT applications. Our ecosystem of partners help integrate our services with IoT hardware customers need to produce smart and secure products, build ready-made solutions, and extend their expertise to help customers achieve their desired outcomes faster. Our customers and partners inspire us by their ingenuity and constant desire to break the boundaries of what is possible today. Understanding their problems and desired outcomes helps us better shape the technology we provide them, and inspires our teams to always strive for more from the solutions we deliver.

Since launching AWS IoT in 2015, we recognize that most, if not all, of our major product milestones are the direct result of learning from the pain points our customers and partners are facing and turning those learnings into solutions that help them securely build and manage IoT devices at scale. This blog post will chronicle several of our key solution milestones and highlight a few of the customers and partners who continue to help us define what it means to be the industry’s best solution for consumer IoT use cases.

2015-2016: AWS IoT is born

Before we announced the general availability of AWS IoT in December 2015, pioneer customers were already building IoT applications using other AWS and Amazon Services. Coupling their feedback with our experiences with Amazon Robotics, drones (Amazon Prime Air), the Amazon Echo and Alexa Voice Service, the Dash Service, and multiple generations of Kindles and FireOS devices, gave us a well-informed perspective on current pain points that added complexity and development time to IoT applications.  We designed AWS IoT Core, a managed cloud service that lets connected devices easily and securely interact with cloud applications and other devices at scale, with all of these learnings in mind.

iRobot uses AWS IoT services for their next generation IoT infrastructureOne of these early customers was iRobot. In September of 2015, as the popularity of the Roomba climbed and the number of connected customers and services quickly multiplied, iRobot recognized it needed an IoT solution that could quickly scale for more direct control. They selected AWS IoT as a core component for their next generation platform. “The AWS serverless architecture and the ease of use of the AWS services inside it free up developer time to produce business value,” said Ben Kehoe, Cloud Robotics Research Scientist, iRobot. Today, iRobot uses AWS IoT services to provision and manage their global connected device fleet (they surpassed 30 million robots sold milestone in 2019!), delivers new innovations in smart home robotics such as the Terra® t7 Robot Mower, and continues to handle holiday traffic spikes of up to 20X their norm with ease.

Another pioneer was Rachio, creator of the Rachio Smart Sprinkler Controller, a WiFi-based irrigation controller that allows consumers to optimize irrigation schedules. The controller consults local weather forecasts and automatically adjusts watering time and volume to account for specific irrigation setups, plants, and soil types in up to 16 different irrigation zones. This allows users to conserve water while not under-watering lawns and landscaping. “For companies wanting to get into the IoT space, tools like AWS IoT enable a faster time to market and eliminate the need to spend months and months and hundreds of thousands of dollars building a solution yourself,” says Franz Garsombke, CTO and Co-Founder of Rachio.

Zimplistic — the makers of Rotimatic, a smart, fully automated flatbread-making robot —use IoT and Machine Learning technology to replicate a bread making process that’s been handed down from parents to their children over generations. Using AWS IoT, Zimplistic can monitor the performance of the machines, making changes to its software if errors occur. Crucially, Zimplistic can also gather data on customer usage and feed that information into design updates. The connectivity also enables Zimplistic to roll out new software quickly and easily to all machines at the same time. This means Rotimatic owners get the convenience of a smart device that repairs itself if an error occurs and is being constantly improved.

2017: Powerful intelligence at the edge, easier device management, and a better way to manage video data generated from connected cameras.

In June 2017, we introduced AWS IoT Greengrass to help customers seamlessly extend AWS to edge devices so they can act locally on the data they generate, while still using the cloud for management, analytics, and durable storage. This functionality is particularly useful for customers managing security cameras, routers, and in-home health monitoring devices, for example.

Electronic Caregiver uses AWS IoT Services like AWS IoT Greengrass for their connected caregiving solutionThis ability to act locally, even when not connected to the Cloud, was critical for Electronic Caregiver, as this enabled them to directly support a patient’s safety and wellbeing in the home. Electronic Caregiver provides patients with wearable gadgets (such as a wrist pendant), 24/7 vitals monitoring devices (such as a contact-free thermometer and a glucose meter), and in-home healthcare solutions that are connected to the cloud but must operate seamlessly day and night at the edge. If a patient’s health reading is atypical, Electronic Caregiver springs into action delivering 24/7 Emergency response if needed to get the patient back on track. From a technical perspective, AWS IoT Greengrass Machine Learning Inference pushes a machine learning model built in Amazon SageMaker directly to the edge device in the user’s home. The patient is asked specific questions to help assess the cause of the anomaly, and then they receive from their device a prediction of the likely reason(s) for this result as well as recommended solutions. These questions and solutions are voiced to the patient with Amazon Lex and Amazon Polly, as well as shared with the patient’s selected stakeholders (such as family members and doctors) so everyone on the individual’s care team is immediately aware.  Today, Electronic Caregiver delivers critical patient information around the world that helps save lives using AWS IoT together with dozens of other AWS services.

While edge use cases were growing in importance, our customers had also seen growth in device fleets, with millions or even tens of millions of devices deployed at hundreds or thousands of locations. At this scale, treating each device individually was impossible. We introduced AWS IoT Device Management to help customers securely onboard, organize, monitor, and remotely manage their IoT devices at scale throughout their lifecycle.

Klika-Tech, an AWS Systems Integration Partner focusing on IoT, Big Data, and Data Visualization solutions, began using AWS IoT Device Management in a number of solutions tailored for consumer IoT use cases. In one such solution, Klika Tech and Stonehenge NYC came together to demonstrate what’s possible in smart apartment technology. Klika Tech built a proof of concept using Alexa, Salesforce, and AWS IoT services including AWS IoT Core, AWS IoT Analytics, and AWS IoT Device Management. As part of the proof of concept, AWS IoT monitored the air conditioning in the apartment, and users could control temperatures using Alexa. Klika Tech created a system for tenants to report service issues via Alexa, which are automatically entered into Salesforce, where they could be monitored and addressed by management.

In 2017, AWS also introduced Amazon Kinesis Video Streams (KVS), a service that makes it easy to securely stream video from connected devices such as security cameras or baby monitors to AWS for machine learning, analytics, and processing. AWS IoT, together with KVS, simplify device management and video streaming for millions of smart home cameras. Comcast migrated to AWS IoT and KVS as well as other AWS services, such as Amazon SageMaker, to power their Xfinity Home security cameras and focus on secure storage of video data from customers worldwide. By using fully-managed services, Comcast was able to develop a solution that was at least 25% less costly than their previous solution and reduced operational burden. This helps them focus their engineering resources on building better customer experiences such as Alexa Voice integration and developing rich playback applications.

Finally, we officially brought FreeRTOS into the AWS IoT portfolio. FreeRTOS is an MIT licensed open source, real-time operating system for microcontrollers that makes small, low-power edge devices easy to program, deploy, secure, connect, and manage. FreeRTOS helps consumer products companies like appliances, wearable technology, or smart lighting manufacturers standardize microcontroller-based device development, delivery, and maintenance across a wide variety of products and models. Customers like Traeger, PetSafe, Hatch, and more use the FreeRTOS kernel to run low-power devices as well as software libraries that make it easy to securely connect to the cloud or other edge devices, so they can collect data from them for IoT applications and take action.
Belkin uses AWS IoT Services to power their Wemo devices
Belkin, a global electronics brand that specializes in connectivity devices, is no stranger to innovation. They launched the original Wemo smart plug in 2012. As their device count grew and Belkin prepared to introduce the next generation, the company needed a solution that would allow them to focus on their product innovations—not on managing their IoT infrastructure—and found one in AWS IoT. By updating its IoT infrastructure with AWS IoT Core and FreeRTOS, Belkin was now prepared to handle a surge in new devices at less cost, while reducing product latency. As the next generation of AWS IoT Core and FreeRTOS–enabled devices reaches more people, such as the newly announced Wemo Mini that works with Alexa, Belkin expects the time and money it saves will lead to more robust data analysis and machine learning, providing opportunities to further improve Wemo devices.

2018: IoT security and robotics

To help customers secure their fleet of devices, we introduced AWS IoT Device Defender, a service that lets you continuously monitor security metrics for deviations from what you have defined as appropriate behavior for each device. If something doesn’t look right, AWS IoT Device Defender sends out an alert so you can take action to remediate the issue. “AWS IoT Device Defender provides device behavior monitoring that is a must-have for any IoT company that is building a secure infrastructure,” says Franz Garsombke, CTO, Rachio. AWS IoT Device Defender was recognized as the “Best IoT Security Solution” at the 2019 IoT World Awards.

At re:Invent 2018 we introduced AWS RoboMaker, a service that leverages AWS IoT Greengrass and helps developers build, test, and deploy robotics applications in the cloud. AWS IoT veteran iRobot uses AWS RoboMaker to quickly discover problems across different product lines, accelerate the pace of their software builds and tests, and to ultimately manufacture higher quality consumer products. “We were already an AWS customer, using AWS IoT services to monitor our robot fleet,” Chris Kruger, Director of Software Engineering at iRobot says. “We trust AWS to deliver reliability, flexibility, and scalability.”

2019: Alexa Voice and two-way video streaming

In September 2019, Amazon announced the general availability of Alexa Connect Kit (ACK), a new way for device makers to connect devices to Alexa without worrying about managing cloud services, writing an Alexa skill, or developing complex networking and security firmware. ACK is built on AWS IoT, and meets the cloud reliability requirements for the Works with Alexa (WWA) certification program. Leading device makers and consumer products companies, including Procter & Gamble and Hamilton Beach, use ACK to develop smart devices.

Following up on the launch of ACK, we released the Alexa Voice Service (AVS) Integration for AWS IoT Core on AWS IoT Day in November 2019. AVS Integration for AWS IoT Core helps customers quickly and cost-effectively go to market with Alexa Built-in capabilities on new categories of products such as light switches, thermostats, and small appliances. AVS Integration for AWS IoT Core lowers the Alexa Built-in cost up to 50 percent by offloading compute and memory intensive workloads to the cloud and lowers the hardware requirements from 100MB to 1MB of RAM and from ARM Cortex ‘A’ class microprocessors to ARM Cortex ‘M’ class microcontrollers. This enables customers to bring Alexa directly to any connected device so users can talk directly to their surroundings rather than to an Alexa Family of Devices. The AVS Integration for AWS IoT Core was highlighted by Gartner in their 2020 Vendor Report as a key example of how Amazon is expanding the breadth and depth of its cloud infrastructure offerings. In this report, Gartner rated Amazon as Strong due to its consistent delivery of capabilities and customer value.

By using the AVS Integration for AWS IoT Core, iDevices was able to accelerate time-to-market from their typical 12-14-month development cycle to 4 months and optimized their infrastructure costs for their Instinct light switch with Alexa Built-in. “If you think about the innovation in the gangbox, the light switches, and outlets, there really hasn’t been anything,” says iDevices CTO, Shawn Monteith. “Now you can control it with voice, and what we’re really trying to do is just extend that technology and bring some innovation to it.”

Finally, at re:Invent 2019 Amazon Kinesis Video Streams added support for real-time two-way media streaming with WebRTC for use cases like home security and monitoring, camera-enabled doorbells, baby and pet monitoring, smart appliances, and more. Wyze uses AWS IoT to connect and manage their consumer devices and Amazon KVS to ingest, store, and process camera video. Now, Wyze has expanded their product offerings to include devices such as light bulbs, smart plugs, locks, contact and motion sensors, and more, delivering innovative experiences at attractive price points across a variety of consumer use cases.

What will 2020 and beyond bring?

In 2020, we have seen companies continue to rely on AWS IoT services to help them cost-effectively deliver innovative consumer IoT products and experiences at scale.

“We have great customers. They challenge us every day to peek around corners and invent the tools they need to build connected ecosystems. Our customers are solving real world problems every day and we love being a part of that process!” says Michael MacKenzie, GM of AWS IoT Connectivity and Control Services.

One such customer is Traeger Grills. Traeger allows users to command their grill from the couch or on-the-go with a WiFi controller that connects a smartphone to the grill via the Traeger App. They saw rapid commercial success and quickly realized they needed a new IoT platform to support their growth—and saw AWS as a way to better integrate different parts of their business. Earlier this year, Traeger worked with a member of the Amazon Partner Network (APN), OST, to migrate hundreds of thousands of grills to AWS IoT Core, FreeRTOS, and OST’s proprietary IP, The IoT Foundation, with no disruptions to the end user’s service. By the end of 2020, Traeger expects that number to quadruple—and with the AWS platform, this growth in capacity is available on demand, allowing Traeger to scale as needed. Traeger Grills also work with Alexa, so users can ask Alexa to set the food probe temperature, check pellet levels during cooking, or to shut down the grill after they are done. Because it’s on AWS’ single, well-integrated platform, Traeger can now bring value, like voice-enable actions, to the market faster.

We always welcome feedback about what to build next – get in touch with our team to let us know what you’d like to see us build, or to learn how to get started with AWS IoT Solutions for the connected home and consumer devices. If you’d like to stay up to date on the latest AWS IoT news, subscribe to our monthly newsletter here.


Big Data: The Most Misunderstood Industry of 2020?

$
0
0

Feed: Featured Blog Posts – Data Science Central.
Author: Julius Cerniauskas.

Among everything else going on in the world, big data is another controversial topic, and the conversations are all over the place: forums, social media networks, articles and blogs.  

That is because big data is really important. 

I’m not saying this only as someone who works in the industry, but as someone who understands the disconnects between what goes on behind the scenes and what’s out there in the media. It’s no secret that quite often big data has a bad reputation, but I don’t think it’s the fault of the data so much as how it’s being used.

The internet is the biggest source of data, and what organizations do with it is what matters most. While data can be analyzed for insights that lead to more strategic business decisions, it can also be stolen from social networks and used for political purposes. Among its almost infinite uses, big data can make our world a better place and this article is going to clear up any misconceptions and hopefully convince you that big data is a force for good. 

What is Big Data, Really?

Most of us know what big data is, but I think a quick summary is essential here. We’ve all observed how industry pundits and business leaders have demonized big data, but that’s like demonizing a knife. A minority of people may use a knife for nefarious purposes while the overwhelming majority of people would have a hard time feeding themselves without one. 

It’s all about context.

A simple explanation I would give anyone outside the industry is that big data refers to the size, speed & complexity of modern data practices that are too difficult or maybe impossible to process using traditional methods.

Doug Laney, a thought leader/consultant and author, initially used the term expressed as a function of three concepts referred to as “the three V’s”:

  • Volume: Part of the “big” in big data involves large amounts of information collected through a range of sources including business transactions, smart (IoT) devices and social media networks
  • Velocity: Big data moves fast through the use of RFID tags, smart meters and sensors that necessitate the need for information to be handled fast
  • Variety: Big data is diverse, derived from many formats including structured numeric data found in databases to unstructured data derived from formats like emails, financial transactions, audio/video files and text documents of all types

Surveillance Capitalism: Why Some People Hate Big Data

Social networks, government bodies, corporations, developer applications, along with a plethora of organizations of all types are interested in what you do, whether you are asleep or awake. 

Everything is being surveyed and collected and this has resulted in an entire business sprouting up around the collection of big data referred to as surveillance capitalism.

I think this is the aspect of big data that concerns everyone. So concerned in fact, that many use the terms interchangeably.

Originally coined by Harvard professor Shoshana Zuboff, surveillance capitalism describes the business of purchasing data from companies that offer “free” services via applications. Users willingly use these services while the companies collect the data and then access to the data is sold to third parties. 

In essence, it’s the commodification of a person’s data with the sole purpose of selling it for a profit, making data the most valuable resource on earth according to some analysts. The data collected and sold enables advertising companies, political parties and other players to perform a wide range of functions that can include specifically targeting people for the sale of goods and services, improving existing products or services, or gauging opinion for political purposes, among many other uses. 

But that’s only part of the story…

Data collection may have various advantages for some individuals and society as a whole. Consider sites like Skycanner, Google Shopping, Expedia and Amazon Sponsored products. 

Just a few short years ago comparison shopping required clicking between several sites. Today with a visit to a single site we can get price comparison on almost every type of product or service. All these sites were built around data collection and represent an example of a service some would say is essential to the ecommerce experience.  

How Big Data is Obtained

Data can be obtained in many ways. One common method is to purchase it from developers of applications or to collect it from a social network. The latter is usually restricted to the owners or stakeholders of the application.

Another way is called “web scraping”. This involves the creation of a script that analyzes a page and collects public information. After collecting the information, the scraped data is then compiled and delivered in a spreadsheet format to the end user for analysis. Referred to as the mining process, this is the stage where the data is analyzed and valuable information is extracted, similar to panning for gold among rocks. 

Specific Web Scraping Examples

Just about any website with publicly available data can be scraped. Some of the most beneficial uses people may be familiar with include:

Price aggregator websites

Whether it’s to book flights, hotel rooms, buy cars or other consumer goods, web scraping is a useful tool for businesses that want to stay price-competitive. The largest benefits accrue to the end-users that are able to source out the lowest prices. 

Tracking World News & Events

Web scraping can be used to extract information and statistics for a variety of world events that include the news, financial market information and the spread of communicable diseases. 

My company partnered with university students in the United States and Switzerland to support the TrackCorona and CoronaMapper websites that used scraped information from various sources to provide COVID-related statistics.

Tracking Fake News

“Fake News” seems to be everywhere and can spread like wildfire on social networks. Several startups are working to combat the problem of misinformation in the news through the use of machine learning algorithms.

Through processes that can analyze and compare large amounts of data, stories can be evaluated to detect their accuracy. While many of these projects are currently in development, they represent innovative solutions to the issue of false information by tracking it from its source. 

Search Engine Optimization (SEO)

Small businesses and new startups looking to get ranked in search engines are in for an uphill battle with the major players dominating page one. Since SEO can be very challenging, web scraping can be leveraged to research specific search terms, title tags, targeted keywords and backlinks for use in an effective strategy that can help smaller players beat the competition. 

Academic Research

The internet provides an almost unlimited source of data that can be used by research professionals, academics and students for papers and studies. Web scraping can be a useful tool to obtain data from public sites in a wide array of areas, providing timely, accurate data on almost any subject. 

Cybersecurity

Cybersecurity is an increasing field that spans a variety of areas that involve the security of computer systems, networking systems and online surveillance. Besides corporate/government concerns, cybersecurity also spans email security, social network monitoring/listening and other forms of tracking that ensure the safety of systems stays intact.

Ethical Web Scraping

Big data is always changing as it grows and evolves, and part of the evolution should include the formation of some generally accepted ethical practices to keep the space free of corruption and mismanagement. 

At Oxylabs, we feel that there are ethical ways to scrape data off the web that doesn’t compromise the ethical concerns of users or the website servers providing them services. 

The guidelines for scraping publicly available data should be based on respect to the intellectual property of third parties and sensitivity to the privacy issues. Also, it is equally important to employ practises that protect servers from the overload of requests.  

Scraping publicly available data with the intent to add value is another suggestion that can enrich the data landscape and enrich the end user’s experience. 

The Bottom Line

Big data has received a terrible reputation thanks to negative perceptions created by the media with respect to recent scandals. The truth is that this is a very narrow definition of what big data is all about. Big data simply refers to the handling of large streams of diverse data that traditional systems could not process. 

Big data has almost unlimited uses with some of the most positive involving optimization strategies that can improve us personally and improve society as a whole. For this reason, factual information should be open and available for everyone. 

At the end of the day it’s about how the data is used, and as an executive of one of the largest proxy providers in the world I can attest to the fact that there are many innovative players in the world today that are using big data as a force for good.

Enterprise Architecture: Secrets to Success

$
0
0

Feed: erwin Expert Blog – erwin, Inc..
Author: Tony Mauro.

For enterprise architecture, success is often contingent on having clearly defined business goals. This is especially true in modern enterprise architecture, where value-adding initiatives are favoured over strictly “foundational,” “keeping the lights on,” type duties.

But what does enterprise architecture success look like?

Enterprise architecture is central to managing change and addressing key issues facing organizations. Today, enterprises are trying to grow and innovate – while cutting costs and managing compliance – in the midst of a global pandemic.

Executives are beginning to turn more to enterprise architects to help quickly answer questions and do proper planning around a number of key issues. The good news is that this is how enterprise architects stay relevant, and why enterprise architect salaries are so competitive.

Here are some of the issues and questions being raised:

  • Growth: How do we define growth strategies (e.g., M&A, new markets, products and businesses)
  • Emerging Markets: What opportunities align to our business (e.g., managing risk vs ROI and emerging countries)?
  • Technology Disruption: How do we focus on innovation while leveraging existing technology, including artificial intelligence, machine learning, cloud and robotics?
  • Customer Engagement: How can we better engage with customers including brand, loyalty, customer acquisition and product strategy?
  • Compliance and Legislation: How do we manage uncertainty around legislative change (e.g., data protection, personal and sensitive data, tax issues and sustainability/carbon emissions)?
  • Data Overload: How do we find and convert the right data to knowledge (e.g., big data, analytics and insights)?
  • Global Operations: How do we make global operations decisions (e.g., operating strategy, global business services and shared services)?
  • Cost Reduction: What can we do to reduce costs while not impacting the business (e.g., balance growth goals with cost reduction, forecast resources needs vs. revenue)?
  • Talent and Human Capital: How do we retain, empower and manage employees and contractors (e.g., learning and development, acquisition and retention, talent development)

Enterprise architecture

Undeniable Enterprise Architecture Truths & the Secrets to Success

As enterprise architects, we need to overcome certain undeniable truths to better serve our organizations:

  1. Management does not always rely on EA to make critical decisions: They often hire consultants to come in for six months to make recommendations.
  2. Today’s enterprises need to be agile to react quickly: Things change fast in our current landscape. Taking months to perform impact analysis and solution design is no longer viable, and data has to be agile.
  3. Enterprise architecture is about more than IT: EA lives within IT and focuses on IT. As a result it loses its business dimension and support.

What can enterprise architects do to be more successful?

First and foremost, we need to build trust in the information we hold within our repositories. That has been challenging because it takes so long to collect and keep relevant and that means our analyses aren’t always accurate and up to date.

With more governance around the information and processes we use to document that information, we can produce more accurate and robust analyses for a true “as-is” view of the entire organization for better decision-making.

Next, we need to close the information gap between enterprise architecture functions that fail to provide real value to their stakeholders. We also need to reduce the cost of curating and governing information within our repositories.

Taking a business-outcome-driven enterprise architecture approach will enhance the value of enterprise architecture. Effective EA is about smarter decision-making, enabling management to make decisions more quickly because they have access to the right information in the right format at the right time.

Taking a business-outcome approach means enterprise architects should:

  • Understand who will benefit the most from enterprise architecture. While many stakeholders sit within the IT organization, business and C-level stakeholders should be able to gain the most.
  • Understand your leadership’s objectives and pain points, and then help them express them in clear business-outcomes. This will take time and skill, as many business users simply ask for system changes without clearly stating their actual objectives.
  • Review your current EA efforts and tooling. Question whether you are providing or managing data the business does not need, whether you are working too deeply in areas that may not be adding value, or whether you have your vital architecture data spread across too many disconnected tools.

Why erwin for Enterprise Architecture?

erwin has a proven track record supporting enterprise architecture initiatives in large, global enterprises in highly regulated environments, such as critical infrastructure, financial services, healthcare, manufacturing and pharmaceuticals.

Whether documenting systems and technology, designing processes and critical value streams, or managing innovation and change, erwin Evolve will help you turn your EA artifacts into insights for better decisions. And the platform also supports business process modeling and analysis. Click here for a free trial of erwin Evolve.

AWS Lambda now supports Amazon Managed Streaming for Apache Kafka as an event source

$
0
0

Feed: Recent Announcements.

Lambda makes it easy to process data streams from Amazon Kinesis Data Streams or Amazon DynamoDB Streams. Now, it’s also easy to read from Apache Kafka topics and process batches of records, one batch per partition at a time. The Lambda function is invoked when the batch size is maximized, or the payload exceeds 6MB. Customers can scale concurrency for their applications by increasing the number of partitions within a topic, with a caveat that using multiple partitions may affect ordering of messages.

To get started, select the Amazon MSK topic as the event source for your Lambda function through the AWS Management Console, AWS CLI, AWS SAM, or AWS SDK for Lambda. Amazon MSK as a Lambda event source is available in all AWS Regions where both AWS Lambda and Amazon MSK are available, with the exception of the AWS China Regions and the AWS GovCloud (US) Regions. This feature requires no additional charge to use. You pay for the Lambda invocations triggered by an Apache Kafka topic. To learn more about building an Apache Kafka consumer application with Lambda, read the Lambda Developer Guide.

Integrating the MongoDB Cloud with Amazon Kinesis Data Firehose

$
0
0

Feed: AWS Big Data Blog.

Amazon Kinesis Data Firehose now supports the MongoDB Cloud platform as one of its delivery destinations. This native integration between Kinesis Data Firehose and MongoDB Cloud provides a managed, secure, scalable, and fault-tolerant delivery mechanism for customers into MongoDB Atlas, a global cloud solution for fully managed MongoDB database service for modern applications.

With the release of Kinesis Data Firehose HTTP endpoint delivery, you can now stream your data through Amazon Data Streams or directly push data to Kinesis Data Firehose and configure it to deliver data to MongoDB Atlas. You can also configure Kinesis Data Firehose to transform the data before delivering it to its destination. You don’t have to write applications and manage resources to read data and push to MongoDB. It’s all managed by AWS, making it easier to estimate costs for your data based on your data volume.

In this post, we discuss how to integrate Kinesis Data Firehose and MongoDB Cloud and demonstrate how to stream data from your source to MongoDB Atlas.

The following diagram depicts the overall architecture of the solution. We configure Kinesis Data Firehose to push the data to a MongoDB Realm event driven serverless javascript function. MongoDB Realm is an intuitive app development service to accelerate your frontend integration by simplifying your backend. We use a specific type of the function called a webhook. The webhook parses the JSON message from Kinesis Data Firehose and inserts parsed records into the MongoDB Atlas database.

Integrating Kinesis Data Firehose and MongoDB Atlas

Kinesis Data Firehose is a fully managed service that automatically scales to match the throughput of your data and requires no ongoing administration. It can also batch, compress, transform, and encrypt the data before loading it, which minimizes the amount of storage used at the destination and increases security.

As part of Kinesis Data Firehose, you can transform your records before delivering them to the destination. In addition, Kinesis Data Firehose enables you to buffer data (based on size or time) before delivering to the final destination. In case of delivery failures, Kinesis Data Firehose can store your failed records in an Amazon Simple Storage Service (Amazon S3) bucket to prevent data loss.

MongoDB Atlas is a platform that can be used across a range of Online Transactional Processing (OLTP) and data analytics applications.  MongoDB Atlas allows developers to address popular use cases such as Internet of Things (IoT), Mobile Apps, Payments, Single View, Customer Data Management and many more.  In all of those cases, developers spend significant amount of time on delivering data to MongoDB Atlas from various data sources.  This integration significantly reduces the amount of development effort by leveraging Kinesis Data Firehose HTTP Endpoint integration to ingest data into MongoDB Atlas.

Creating a MongoDB Cloud Realm Application

  1. Log into your MongoDB cloud account. If you do not have an account you can sign up for a free account.
  2. Create an HTTP endpoint on the MongoDB Atlas platform by choosing 3rd Party Services on the Realm tab.
  3. Choose Add a Service.

  1. Choose HTTP.
  2. For Service Name, enter a name. Your service will appear under this name on the UI.

  1. Choose Add Incoming Webhook.

  1. For Authentication, select System.

  1. Leave other options at their default.
  2. In the function editor, enter the following code:
exports = function(payload, response) {
  
    const decodeBase64 = (s) => {
        var e={},i,b=0,c,x,l=0,a,r='',w=String.fromCharCode,L=s.length
        var A="ABCDEFGHIJKLMNOPQRSTUVWXYZabcdefghijklmnopqrstuvwxyz0123456789+/"
        for(i=0;i<64;i++){e[A.charAt(i)]=i}
        for(x=0;x<L;x++){
            c=e[s.charAt(x)];b=(b<<6)+c;l+=6
            while(l>=8){((a=(b>>>(l-=8))&0xff)||(x<(L-2)))&&(r+=w(a))}
        }
        return r
    }
    
    var fullDocument = JSON.parse(payload.body.text());
    
    const firehoseAccessKey = payload.headers["X-Amz-Firehose-Access-Key"]
    console.log('should be: ' + context.values.get("KDFH_SECRET_KEY"));
 
   // Check shared secret is the same to validate Request source
   if (firehoseAccessKey == context.values.get("KDFH_SECRET_KEY")) {
 

      var collection = context.services.get("Cluster0").db("kdf").collection("kdf-test");
      
      fullDocument.records.forEach((record) => {
            const document = JSON.parse(decodeBase64(record.data))
            const status = collection.insertOne(document);
            console.log("got status: "+ status)
      })

      response.setStatusCode(200)
            const s = JSON.stringify({
                requestId: payload.headers['X-Amz-Firehose-Request-Id'][0],
                timestamp: (new Date()).getTime()
            })
            response.addHeader(
                "Content-Type",
                "application/json"
            );
            response.setBody(s)
            console.log("response JSON:" + s)
      return
   } else {
    response.setStatusCode(500)
            response.setBody(JSON.stringify({
                requestId: payload.headers['X-Amz-Firehose-Request-Id'][0],
                timestamp: (new Date()).getTime()
                errorMessage: "Error authenticating"
            }))
    return
   }
};

The preceding code is a simplified implementation of the webhook. The webhook inserts records one at a time and has abbreviated for readability error handling. For more information about the full implementation, see Using MongoDB Realm WebHooks with Amazon Kinesis Data Firehose.

This webhook uses the values and secrets of MongoDB Realm.

  1. On the Realm tab, choose Values & Secrets.

  1. On the Secrets tab, choose Create New Secret/Add a Secret.

  1. Enter the Secret Name and Secret Value and click save. The Secret Name entered here is the name used in webhook code.

  1. On the Values tab, choose Create New Value/dd a Value.

  1. Enter the Value Name.
  2. For Value Type, select Secret.
  3. For Secret Name, choose the secret you created.

  1. Choose Save.

You can now use the secret in your webhook function.

  1. Choose REVIEW & DEPLOY.

Creating a Kinesis Data Firehose delivery stream to MongoDB

  1. Log into AWS Console and search for Kinesis.
  2. On the Kinesis Data Firehose console, choose Create delivery stream.
  3. For Delivery stream name, enter a name.
  4. For Source, choose Direct PUT of other sources.
  5. Choose Next.

  1. On the Process recordspage, keep all settings at their default and choose Next.
  2. From the Third-party partner drop-down menu, choose MongoDB Cloud.

  1. For MongoDB Realm Webhooks HTTP Endpoint URL, please enter the URL of realm app that was created in MongoDB cloud console.
  2. For API Key, please enter the secret value stored in MongoDB secrets section.
  3. For Content encoding, leave it as Disabled.
  4. For S3 backup mode, select Failed data only.
  5. For S3 bucket, enter the S3 bucket for delivery of log events that exceeded the retry duration. Alternatively, you can create a new bucket by choosing Create new.
  6. Click on Next.
  7. For MongoDB buffer conditions, accept the default MongoDB and Amazon S3 buffer conditions for your stream.  Note that the buffer size should be a value between 1MiB and 16MiB.  Review the limits in MongoDB Atlas documentation.

  1. In the IAM role section, configure permissions for your delivery stream by choosing Create or update IAM role.
  2. Choose Next.
  3. Review your settings and choose Create delivery stream.

As part of HTTP endpoint integration, Kinesis Data Firehose only supports HTTPS endpoints. The server-side TLS/SSL certificate must be signed by a trusted Certificate Authority (CA) and is used for verification by Kinesis Data Firehose.

The body of the request that is delivered from Kinesis Data Firehose is a JSON document with the following schema:

"$schema": http://json-schema.org/draft-07/schema#

title: FirehoseCustomHttpsEndpointRequest
description: >
  The request body that the Firehose service sends to
  custom HTTPS endpoints.
type: object
properties:
  requestId:
    description: >
      Same as the value in the X-Amz-Firehose-Request-Id header,
      duplicated here for convenience.
    type: string
  timestamp:
    description: >
      The timestamp (milliseconds since epoch) at which the Firehose
      server generated this request.
    type: integer
  records:
    description: >
      The actual records of the Delivery Stream, carrying 
      the customer data.
    type: array
    minItems: 1
    maxItems: 10000
    items:
      type: object
      properties:
        data:
          description: >
            The data of this record, in Base64. Note that empty
            records are permitted in Firehose. The maximum allowed
            size of the data, before Base64 encoding, is 1024000
            bytes; the maximum length of this field is therefore
            1365336 chars.
          type: string
          minLength: 0
          maxLength: 1365336

required:
  - requestId
  - records

The records are delivered as a collection based on BufferingHints configured on the Firehose delivery stream. The delivery-side service webhook created on MongoDB Realm has to process these records one by one before inserting them into MongoDB collections or use the MongoDB Bulk APIs.

When Kinesis Data Firehose is set up with an HTTP endpoint destination to MongoDB Cloud, you can push data into Kinesis Data Firehose using Kinesis Agent or SDK from your application. Kinesis Data Firehose is also integrated with other AWS data sources such as Kinesis Data Streams, AWS IoT, Amazon CloudWatch Logs, and Amazon CloudWatch Events.

To test the integration, use the testing option on the Kinesis Data Firehose console and test with sample data. After the time configured in BufferingHints, log in to your Atlas platform and navigate to your Database/Collection to see the ingested records.

Conclusion

In this post, we showed how easy it is to ingest data into the MongoDB Cloud platform using a Kinesis Data Firehose HTTP endpoint. This integration has many use cases.  For example you can stream Internet of Things (IoT) data directly into MongoDB Atlas platform with minimum code using AWS Kinesis Data Firehose HTTP endpoint integration.  Try MongoDB Atlas on AWS here.


About the Author

Anusha Dharmalingam is a Solutions Architect at Amazon Web Services, with a passion for Application Development and Big Data solutions. Anusha works with enterprise customers to help them architect, build, and scale applications to achieve their business goals.

Igor Alekseev is a Partner Solution Architect at AWS in Data and Analytics. Igor works with strategic partners helping them build complex, AWS-optimized architectures. Prior joining AWS, as a Data/Solution Architect, he implemented many projects in Big Data, including several data lakes in the Hadoop ecosystem. As a Data Engineer, he was involved in applying AI/ML to fraud detection and office automation. Igor’s projects were in a variety of industries including communications, finance, public safety, manufacturing, and healthcare. Earlier, Igor worked as full stack engineer/tech lead.
Dynamically Rename Processed Files within Alteryx: A Step-by-Step Guide

$
0
0

Feed: The Information Lab.
Author: jess.hancock.

17 August, 2020

Dynamically Rename Processed Files within Alteryx: A Step-by-Step Guide

It can be tricky when working with a large number of files in Alteryx to remember which ones have been processed, especially when they’re all kept in a central directory. Manual file management is not only a time sink, but prone to human error. If only Alteryx could do the hard work for you!

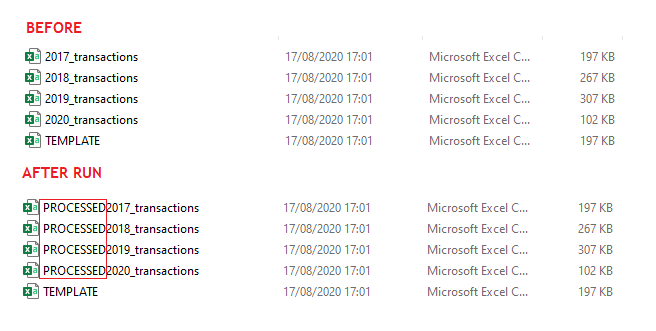
Thankfully, there is a fairly elegant solution. This blog will demonstrate how to build a ‘Renaming’ process into your workflows, prompting Alteryx to add an identifying feature into the names of your input files once they’ve been successfully run through the workflow. And yes, this is ‘Rename’ with a capital ‘R’: this process will change their names permanently, outside of Alteryx, as seen in File Explorer.

‘Successfully run’ is the key phrase here: should Alteryx stumble upon any errors while writing your outputs, the original files will remain untouched, so no unread files are unintentionally marked as processed. The workflow also prevents these files from being re-run, avoiding duplicate data. All in all, a resilient approach.

Before we delve into the details, here’s a reference screenshot of the complete workflow:

(Text too small? Try downloading the images, or loading them in a new browser window.)

Let’s break down the process.

1. Dynamically Input Files

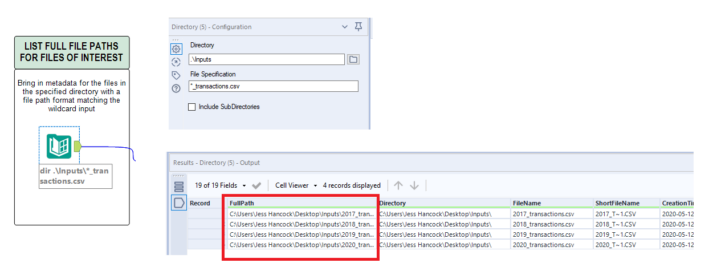
Here, we’re working with data contained in .CSV files, with consistent name formats and schemas (structures, column headers, etc.). The Directory tool is used to return the metadata for files in the specified directory which match the File Specification.

(In this example, we use the relative filepath notation ‘.Inputs’, which tells Alteryx to start looking in the same folder as the workflow (.) and choose the Inputs sub-folder. The wildcard (*) notation can be read as ‘anything’: here, ‘[anything]_transactions.csv’, will pull in ‘2017_transactions.csv’, ‘2018_transactions.csv’ and so on.)

‘FullPath’, a field containing the full path of the file (including filename and extension) is the field we’re interested in.

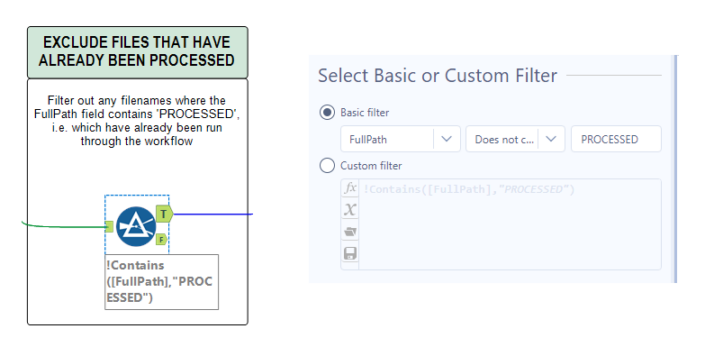
Drop in a filter to exclude file paths which contain the word ‘PROCESSED’:

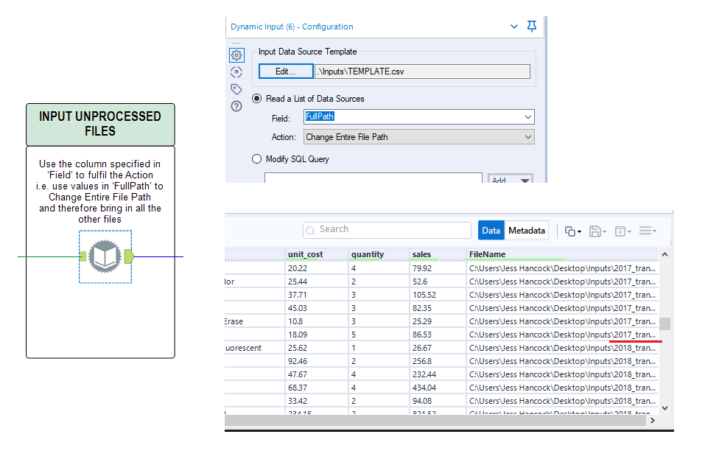
Take the ‘True’ output and feed these unprocessed files into a Dynamic Input tool, found via search or in the Developer tool palette:

The top option, ‘Input Data Source Template’, requires the user to specify a single ‘guiding’ file: this is so Alteryx can understand what to expect schematically of the files to be brought in. When configured as below, the Dynamic Input will use the FullPath field to read in the list of data sources. Alteryx stacks the data in these files on top of each other, much as a Union tool does, to create a consolidated table.

(Confusingly, the full file path is now in a field called ‘FileName’!)

INSERT WORKFLOW HERE.

This is the part where you conduct all your data magic: transform and analyse as you like. You will need the FileName field to be present at the end, so Alteryx can be told which files to rename.

2. Split into Two Data Streams: ‘Output’ and ‘Renaming’

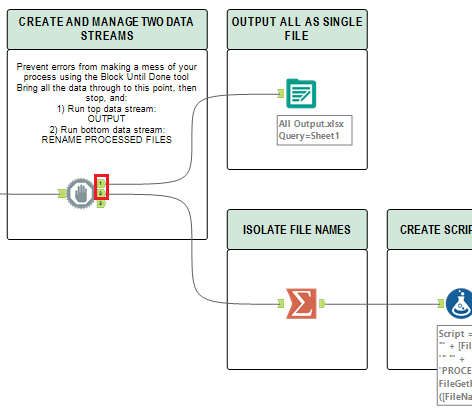
The second part of the process begins with a Block Until Done tool, again found within the Developer palette:

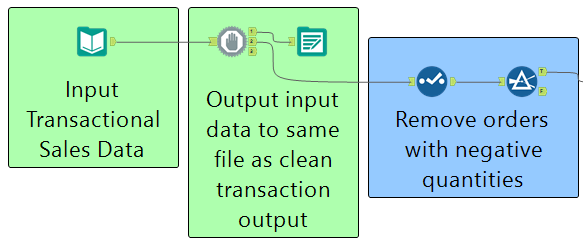
Set up as shown, this tool ensures the actual data file/s you’re interested in are written first (as they’re streamed from the priority ‘1’ output). In this example, all our data is output into a single .xlsx file.

Once run without issue, the input files used can be renamed — this happens in the stream from output ‘2’.

3. ‘Renaming’ Stream: Create and Run Script

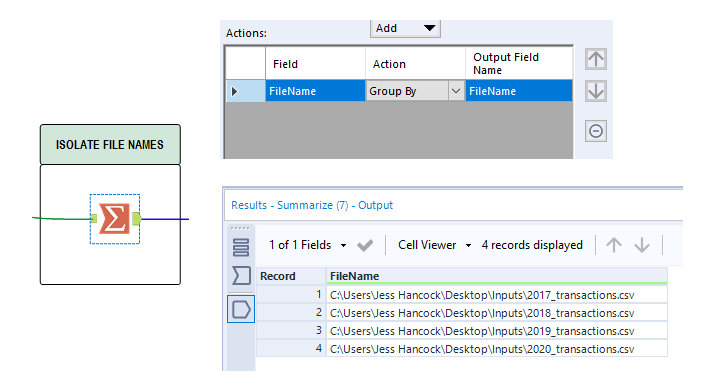
Begin by isolating the individual input file names. You can use a Summarize tool that groups by FileName:

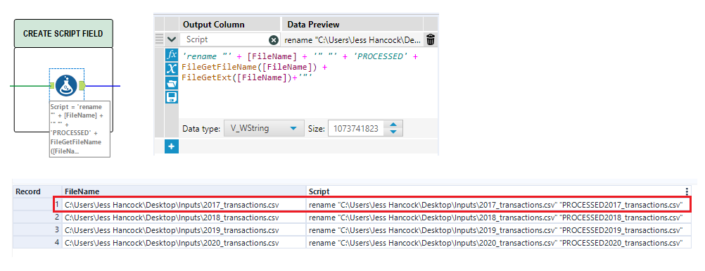
Then, use a Formula tool to create the ‘Script’ field. At the moment, it’s just a static String field within Alteryx, but it will form the basis of the command to be ‘read’ by the command line. 

Here’s a version of the formula you can copy:

‘rename “‘ + [FileName] + ‘” “‘ + ‘PROCESSED’ + FileGetFileName([FileName]) + FileGetExt([FileName])+’”‘

The command is straightforward: ‘Rename “[CurrentFilePath]” “[NewName]”. The new name is cobbled together at the end of the formula by adding the prefix ‘PROCESSED’ to the existing [File Name] and [Extension].

(Note: Don’t include the full file path when specifying a new name, or the process will error out.)

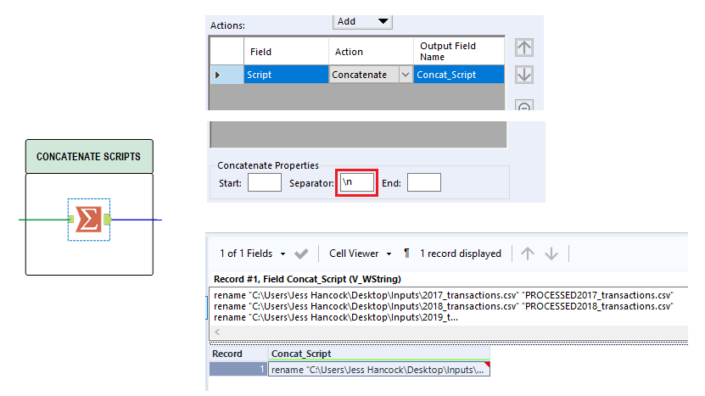
So these scripts can be run consecutively, use another Summarize tool and concatenate the Script field. Use ‘n’, i.e. a new line, as the separator:

Now we’re ready to feed our script into the Run Command tool. (The fun begins!)

For context, the Run Command tool engages the computer’s command line, which is entirely separate to Alteryx. Most operating systems have an interface to interact with the command line (such as Command Prompt for Windows); with these, users type commands for the computer to execute. A huge variety of important back-end bits take place using the command line, including troubleshooting, and tasks can also be automated via scripts (such as the one we wrote above).

To quote the official documentation, the Run Command tool ‘is similar to running applications directly from the Windows command line, but with the convenience of remaining within the Alteryx GUI’. In short: we’re engaging the command line automatically, from within Alteryx. We need little, if any, expert knowledge for it.

You can find the Run Command tool in the Developer tool palette, or, as always, by using the Global Search.

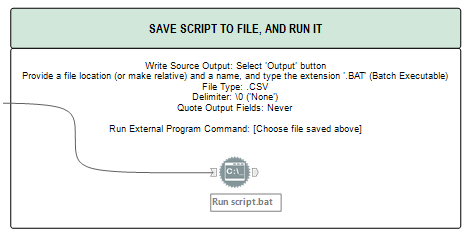
The tool configuration is as follows:

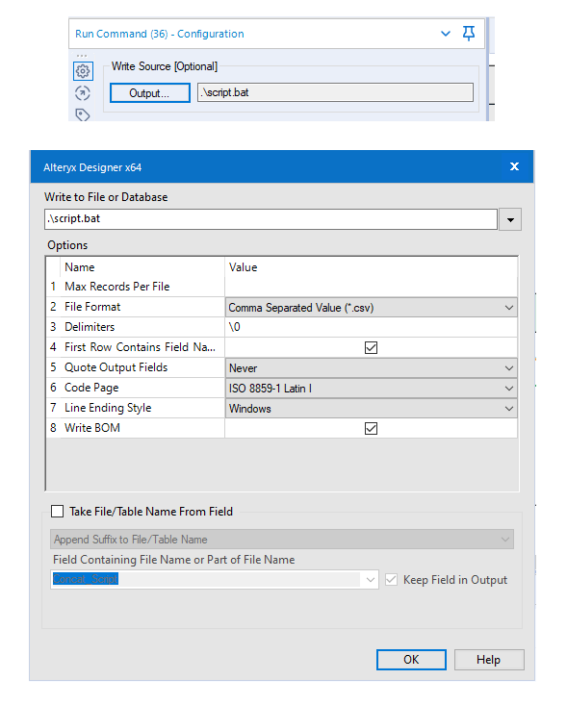
For clarity, I’ll walk through those steps with screenshots of the UI.

Once the Run Command tool is on your canvas, and has been selected, press the ‘Output…’ button at the top of the configuration pane. Here, we tell Alteryx where to save the script and what properties it should have. A window will appear that mirrors the options of the standard Output tool, which makes sense: we’re generating an output here too, albeit an unusual one.

Configure your window to match; then press OK.

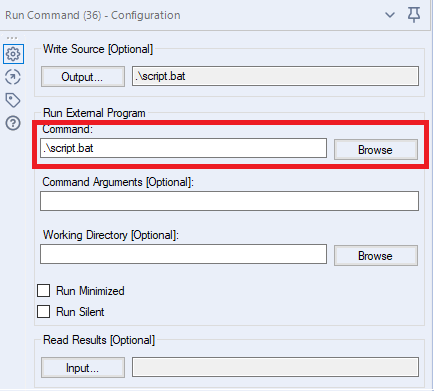
In the configuration pane, copy the file path from the first option and paste it as follows:

This ‘Run External Program Command’ option locates and runs the script we just saved.

With the tool configured and ready to go, you can run your workflow.

…And that’s it! Navigate to your original input folder to see what’s changed: with any luck, your recently-run files have new names, and you now have an automated and resilient process to work with in the future.

Want more on the Run Command tool? The official Alteryx page is a good place to start: https://help.alteryx.com/current/designer/run-command-tool

Notes

  • You are unable to upload workflows containing the Run Command tool to the public Alteryx Gallery without first applying for an exemption: https://gallery.alteryx.com/#!exemption. You can upload them to private instances of Alteryx Server and Alteryx Gallery.
  • Be aware that other means of sharing may be blocked if there is reference to, or inclusion of, the script: Gmail did not let me email a .ZIP file of the workflow and resources when the ‘.bat’ file was present within it. This is sensible: you don’t mess with executables!

Enhancing customer safety by leveraging the scalable, secure, and cost-optimized Toyota Connected Data Lake

$
0
0

Feed: AWS Big Data Blog.

Toyota Motor Corporation (TMC), a global automotive manufacturer, has made “connected cars” a core priority as part of its broader transformation from an auto company to a mobility company. In recent years, TMC and its affiliate technology and big data company, Toyota Connected, have developed an array of new technologies to provide connected services that enhance customer safety and the vehicle ownership experience. Today, Toyota’s connected cars come standard with an on-board Data Communication Module (DCM) that links to a Controller Area Network (CAN). By using this hardware, Toyota provides various connected services to its customers.

Some of the connected services help drivers to safely enjoy their cars. Telemetry data is available from the car 24×7, and Toyota makes the data available to its dealers (when their customers opt-in for data sharing). For instance, a vehicle’s auxiliary battery voltage declines over time. With this data, dealership staff can proactively contact customers to recommend a charge prior to experiencing any issues. This automotive telemetry can also help fleet management companies monitor vehicle diagnostics, perform preventive maintenance and help avoid breakdowns.

There are other services such as usage-based auto insurance that leverage driving behavior data that can help safe drivers receive discounts on their car insurance. Telemetry plays a vital role in understanding driver behavior. If drivers choose to opt-in, a safety score can be generated based on their driving data and drivers can use their smartphones to check their safe driving scores.

A vehicle generates data every second, which can be bundled into larger packets at one-minute intervals. With millions of connected cars that have data points available every second, the incredible scale required to capture and store that data is immense—there are billions of messages daily generating petabytes of data. To make this vision a reality, Toyota Connected’s Mobility Team embarked on building a real-time “Toyota Connected Data Lake.” Given the scale, we leveraged AWS to build this platform. In this post, we show how we built the data lake and how we provide significant value to our customers.

Overview

The guiding principles for architecture and design that we used are as follows:

  • Serverless: We want to use cloud native technologies and spend minimal time on infrastructure maintenance.
  • Rapid speed to market: We work backwards from customer requirements and iterate frequently to develop minimally viable products (MVPs).
  • Cost-efficient at scale.
  • Low latency: near real time processing.

Our data lake needed to be able to:

  • Capture and store new data (relational and non-relational) at petabyte scale in real time.
  • Provide analytics that go beyond batch reporting and incorporate real time and predictive capabilities.
  • Democratize access to data in a secure and governed way, allowing our team to unleash their creative energy and deliver innovative solutions.

The following diagram shows the high-level architecture

Walkthrough

We built the serverless data lake with Amazon S3 as the primary data store, given the scalability and high availability of S3. The entire process is automated, which reduces the likelihood of human error, increases efficiency, and ensures consistent configurations over time, as well as reduces the cost of operations.

The key components of a data lake include Ingest, Decode, Transform, Analyze, and Consume:

  • IngestConnected vehicles send telemetry data once a minute—which includes speed, acceleration, turns, geo location, fuel level, and diagnostic error codes. This data is ingested into Amazon Kinesis Data Streams, processed through AWS Lambda to make it readable, and the “raw copy” is saved through Amazon Kinesis Data Firehose into an S3
  • Decode:  Data arriving into the Kinesis data stream in the ‘Decode’ pillar is decoded by a serverless Lambda function, which does most of the heavy lifting. Based upon a proprietary specification, this Lambda function does the bit-by-bit decoding of the input message to capture the particular sensor values. The small input payload of 35KB with data from over 180 sensors is now decoded and converted to a JSON message of 3 MB. This is then compressed and written to the ‘Decoded S3 bucket’.
  • Transform The aggregation jobs leverage the massively parallel capability of Amazon EMR, decrypt the decoded messages and convert the data to Apache Parquet Apache Parquet is a columnar storage file format designed for querying large amounts of data, regardless of the data processing framework, or programming language. Parquet allows for better compression, which reduces the amount of storage required. It also reduces I/O, since we can efficiently scan the data. The data sets are now available for analytics purposes, partitioned by masked identification numbers as well as by automotive models and dispatch type. A separate set of jobs transform the data and store it in Amazon DynamoDB to be consumed in real time from APIs.
  • ConsumeApplications needing to consume the data make API calls through the Amazon API Gateway. Authentication to the API calls is based on temporary tokens issued by Amazon Cognito.
  • AnalyzeData analytics can be directly performed off Amazon S3 by leveraging serverless Amazon Athena. Data access is democratized and made available to data science groups, who build and test various models that provide value to our customers.

Additionally, comprehensive monitoring is set up by leveraging Amazon CloudWatch, Amazon ES, and AWS KMS for managing the keys securely.

Scalability

The scalability capabilities of the building blocks in our architecture that allow us to reach this massive scale are:

  • S3: S3 is a massively scalable key-based object store that is well-suited for storing and retrieving large datasets. S3 partitions the index based on key name. To maximize performance of high-concurrency operations on S3, we introduced randomness into each of the Parquet object keys to increase the likelihood that the keys are distributed across many partitions.
  • Lambda: We can run as many concurrent functions as needed and can raise limits as required with AWS support.
  • Kinesis Firehose: It scales elastically based on volume without requiring any human intervention. We batch requests up to 128MiB or 15 minutes, whichever comes earlier to avoid small files. Additional details are available in Srikanth Kodali’s blog post.
  • Kinesis Data Streams: We developed an automated program that adjusts the shards based on incoming volume. This is based on the Kinesis Scaling Utility from AWS Labs, which allows us to scale in a way similar to EC2 Auto Scaling groups.
  • API Gateway: automatically scales to billions of requests and seamlessly handles our API traffic.
  • EMR cluster: We can programmatically scale out to hundreds of nodes based on our volume and scale in after processing is completed.

Our volumes have increased seven-fold since we migrated to AWS and we have only adjusted the number of shards in Kinesis Data Streams and the number of core nodes for EMR processing to scale with the volume.

Security in the AWS cloud

AWS provides a robust suite of security services, allowing us to have a higher level of security in the AWS cloud. Consistent with our security guidelines, data is encrypted both in transit and at rest. Additionally, we use VPC Endpoints, allowing us to keep traffic within the AWS network.

Data protection in transit:

Data protection at rest:

  • S3 server-side encryption handles all encryption, decryption and key management transparently. All user data stored in DynamoDB is fully encrypted at rest, for which we use an AWS-owned customer master key at no additional charge. Server-side encryption for Kinesis Data streams and Kinesis Data Firehose is also enabled to ensure that data is encrypted at rest.

Cost optimization

Given our very large data volumes, we were methodical about optimizing costs across all components of the infrastructure. The ultimate goal was to figure out the cost of the APIs we were exposing. We developed a robust cost model validated with performance testing at production volumes:

  • NAT gateway: When we started this project, one of the significant cost drivers was traffic flowing from Lambda to Kinesis Data Firehose that went over the NAT gateway, since Kinesis Data Firehose did not have a VPC endpoint. Traffic flowing through the NAT gateway costs $0.045/GB, whereas traffic flowing through the VPC endpoint costs $0.01/GB. Based on a product feature request from Toyota, AWS implemented this feature (VPC Endpoint for Firehose) early this year. We implemented this feature, which resulted in a four-and-a-half-fold reduction in our costs for data transfer.
  • Kinesis Data Firehose: Since Kinesis Data Firehose did not support encryption of data at rest initially, we had to use client-side encryption using KMS–this was the second significant cost driver. We requested a feature for native server-side encryption in Kinesis Data Firehose. This was released earlier this year and we enabled server-side encryption on the Kinesis Data Firehose stream. This removed the Key Management Service (KMS), resulting in another 10% reduction in our total costs.

Since Kinesis Data Firehose charges based on the amount of data ingested ($0.029/GB), our Lambda function compresses the data before writing to Kinesis Data Firehose, which saves on the ingestion cost.

  • S3– We use lifecycle policies to move data from S3 (which costs $0.023/GB) to Amazon S3 Glacier (which costs $0.004/GB) after a specified duration. Glacier provides a six-fold cost reduction over S3. We further plan to move the data from Glacier to Amazon S3 Glacier Deep Archive (which costs $0.00099/GB), which will provide us a four-fold reduction over Glacier costs. Additionally, we have set up automated deletes of certain data sets at periodic intervals.
  • EMR– We were planning to use AWS Glue and keep the architecture serverless, but made the decision to leverage EMR from a cost perspective. We leveraged spot instances for transformation jobs in EMR, which can provide up to 60% savings. The hourly jobs complete successfully with spot instances, however the nightly aggregation jobs leveraging r5.4xlarge instances failed frequently as sufficient spot capacity was not available. We decided to move to “on-demand” instances, while we finalize our strategy for “reserved instances” to reduce costs.
  • DynamoDB: Time to Live (TTL) for DynamoDB lets us define when items in a table expire so that they can be automatically deleted from the database. We enabled TTL to expire objects that are not needed after a certain duration. We plan to use reserved capacity for read and write control units to reduce costs. We also use DynamoDB auto scaling ,which helps us manage capacity efficiently, and lower the cost of our workloads because they have a predictable traffic pattern. In Q2 of 2019, DynamoDBremoved the associated costs of DynamoDB Streams used in replicating data globally, which translated to extra cost savings in global tables.
  • Amazon DynamoDB Accelerator(DAX):  Our DynamoDB tables are front-ended by DAX, which improves the response time of our application by dramatically reducing read latency, as compared to using DynamoDB. Using DAX, we also lower the cost of DynamoDB by reducing the amount of provisioned read throughput needed for read-heavy applications.
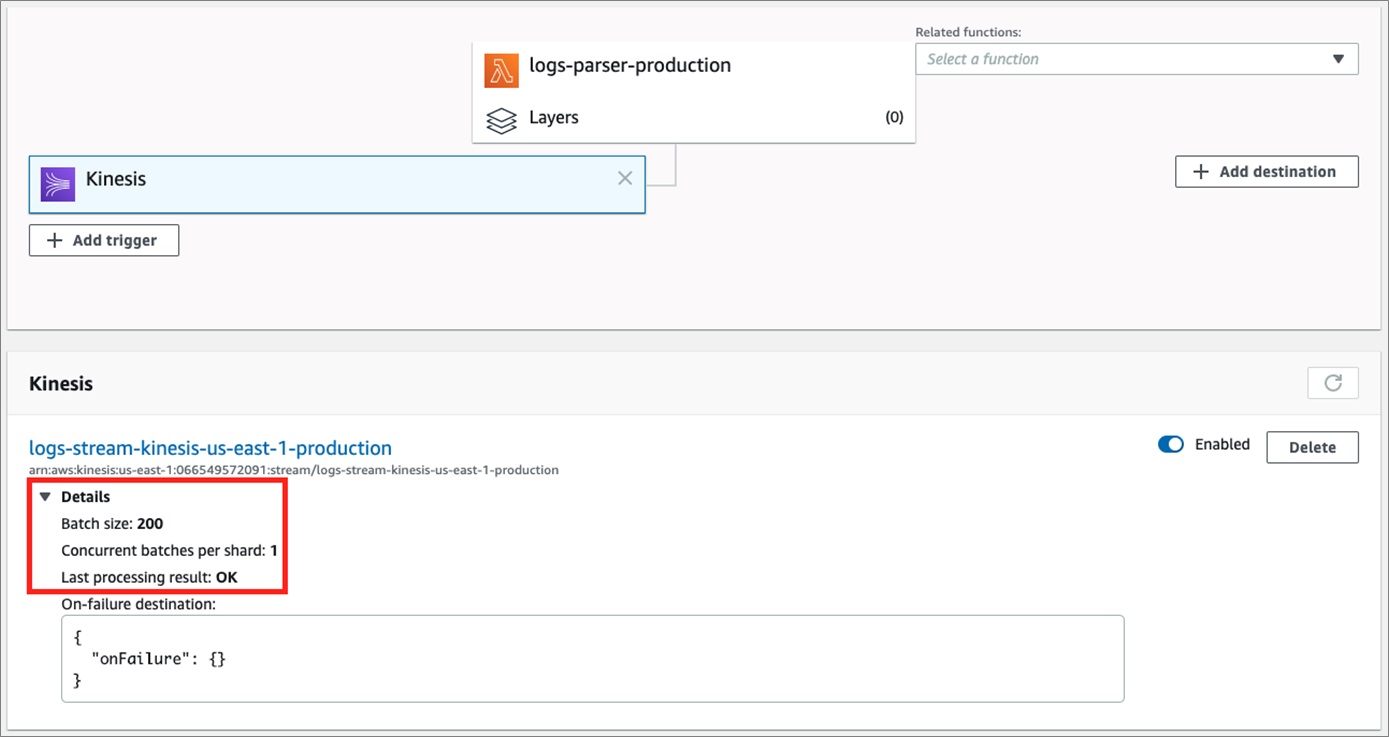
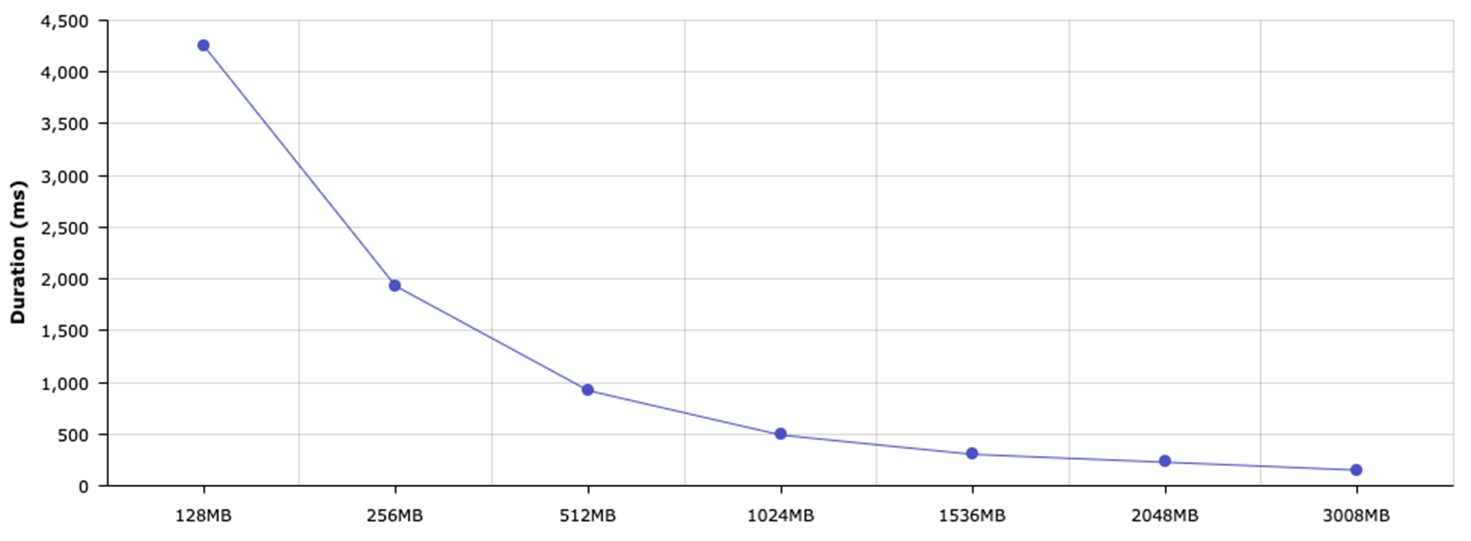
  • Lambda: We ran benchmarks to arrive at the optimal memory configuration for Lambda functions. Memory allocation in Lambda determines CPU allocation and for some of our Lambda functions, we allocated higher memory, which results in faster execution, thereby reducing the amount of GB-seconds per function execution, which saves time and cost. Using DynamoDB Accelerator (DAX) from  Lambda has several benefits for serverless applications that also use DynamoDB. DAX can improve the response time of your application by dramatically reducing read latency, as compared to using DynamoDB. For serverless applications, combining Lambda with DAX provides an additional benefit: Lower latency results in shorter execution times, which means lower costs for Lambda.
  • Kinesis Data Streams: We scale our streams through an automated job, since our traffic patterns are fairly predictable. During peak hours we add additional shards and delete them during the off-peak hours, thus allowing us to reduce costs when shards are not in use

Enhancing customer safety

The Data Lake presents multiple opportunities to enhance customer safety. Early detection of market defects and pinpointing of target vehicles affected by those defects is made possible through the telemetry data ingested from the vehicles. This early detection leads to early resolution way before the customer is affected. On-board software in the automobiles can be constantly updated over-the-air (OTA), thereby saving time and costs. The automobile can generate a Health Check Report based on the driving style of its drivers, which can create the ideal maintenance plan for drivers for worry-free driving.

The driving data for an individual driver based on speed, sharp turns, rapid acceleration, and sudden braking can be converted into a “driver score” which ranges from 1 to 100 in value. The higher the driver-score, the safer the driver. Drivers can view their scores on mobile devices and monitor the specific locations of harsh driving on the journey map. They can then use this input to self-correct and modify their driving habits to improve their scores, which will not only result in a safer environment but drivers could also get lower insurance rates from insurance companies. This also gives parents an opportunity to monitor the scores for their teenage drivers and coach them appropriately on safe driving habits. Additionally, notifications can be generated if the teenage driver exceeds an agreed-upon speed or leaves a specific area.

Summary

The automated serverless data lake is a robust scalable platform that allows us to analyze data as it becomes available in real time. From an operations perspective, our costs are down significantly. Several aggregation jobs that took 15+ hours to run, now finish in 1/40th of the time. We are impressed with the reliability of the platform that we built. The architectural decision to go serverless has reduced operational burden and will also allow us to have a good handle on our costs going forward. Additionally, we can deploy this pipeline in other geographies with smaller volumes and only pay for what we consume.

Our team accomplished this ambitious development in a short span of six months. They worked in an agile, iterative fashion and continued to deliver robust MVPs to our business partners. Working with the service teams at AWS on product feature requests and seeing them come to fruition in a very short time frame has been a rewarding experience and we look forward to the continued partnership on additional requests.


About the Authors


Sandeep Kulkarni drives Cloud Strategy and Architecture for Fortune 500 companies.
His passion is to accelerate digital transformation for customers and build highly scalable and cost-effective solutions in the cloud. In his spare time, he loves to do yoga and gardening.

Shravanthi Denthumdas is the director of mobility services at Toyota Connected.Her team is responsible for building the Data Lake and delivering services that allow drivers to safely enjoy their cars. In her spare time, she likes to spend time with her family and children.

Amazon Kinesis Data Streams announces two new API features to simplify consuming data from Kinesis streams

$
0
0

Feed: Recent Announcements.

Kinesis Client Library (KCL) helps you quickly build custom consumer applications by handling complex issues such as adapting to changes in stream volume, load-balancing streaming data, coordinating distributed workers, and processing data with fault-tolerance. KCL enables you to focus on business logic while building consumer applications. Customers using the latest KCL versions, KCL 1.14 for standard consumers and KCL 2.3 for EFO consumers, will automatically benefit from these two new features.  

Amazon Kinesis Data Streams is a massively scalable and durable real-time data streaming service. It can continuously capture gigabytes of data per second from hundreds of thousands of sources like website clickstreams, IoT data, database event streams, financial transactions, social media feeds, IT logs, and location-tracking events. The data collected is available in milliseconds for real-time analytics use cases like dashboards, anomaly detection, dynamic pricing, and more.  


Scale your cloud data warehouse and reduce costs with the new Amazon Redshift RA3 nodes with managed storage

$
0
0

Feed: AWS Big Data Blog.

One of our favorite things about working on Amazon Redshift, the cloud data warehouse service at AWS, is the inspiring stories from customers about how they’re using data to gain business insights. Many of our recent engagements have been with customers upgrading to the new instance type, Amazon Redshift RA3 with managed storage. In this post, we share experiences from customers using Amazon Redshift for the first time, and existing customers upgrading from DS2 (Dense Storage 2) and DC2 (Dense Compute 2) instances to gain improvements in performance and storage capacity for the same or lower costs.

From startups to global quick service restaurants and major financial institutions, Amazon Redshift customers span across all industries and sizes, including many Fortune 500 companies. We’re proud that Amazon Redshift breaks down cost and accessibility barriers of a data warehouse, so startups and non-profits can realize the same benefits as established enterprises from running analytics at scale with Amazon Redshift.

The diverse customer base also allows the Amazon Redshift team to continue to innovate with new features and capabilities that deliver the best price performance for any use case. Use cases range from analytics that help Britain’s railways run smoothly, to providing insight into the behavior of millions of people learning a new language, playing online games, learning to code, and much more. As the world around us responds to changes in every aspect of personal and business life, Amazon Redshift is helping tens of thousands of customers respond with fast and powerful analytics.

More and more customers have gravitated to Amazon Redshift because of continued innovation, including the new generation of Amazon Redshift nodes, RA3 with managed storage. This latest generation of Amazon Redshift is unique because it introduces the ability to independently scale compute and storage with Redshift managed storage, (RMS). This enables you to scale cost-effectively because you can add more data without increasing compute cost, or add more compute without increasing storage costs. This makes RA3 a cost-effective option for both steady and diverse data warehouse workloads, gives you room to grow, and maximizes performance.

New customers like Poloniex and OpenVault benefit from the flexibility of Amazon Redshift RA3

Many customers are growing and looking for a cloud data warehouse that can scale with them, easily integrate with other AWS services, and deliver great value. For customers like Poloniex and OpenVault, who are just getting started with Amazon Redshift, we recommend using the new RA3 nodes with managed storage. New customers like RA3 because you can size your data warehouse for your core workload and easily scale for spikes in users and data to balance performance and costs. For example, you can use concurrency scaling to automatically scale out when the number of queries suddenly spike up, or use elastic resize to scale up and add nodes to make queries run faster. If you’re using clusters intermittently, you can pause and resume on a schedule or manually. You can further reduce costs on steady state clusters by investing in reserved instances with a 1- or 3-year commitment.

Poloniex, one of the longest standing cryptocurrency trading platforms in the world, distributing hundreds of billions of dollars in cryptoassets, uses AWS to gain insights into how users interact with their platform and how they can improve the customer experience in trading, lending, storing, and distribution. They evaluated multiple data warehousing options and chose to work with AWS to design a lake house approach by querying and joining data across their Amazon Redshift data warehouse and Amazon Simple Storage Service (Amazon S3) data lake with the Amazon Redshift Spectrum feature.

“When we were evaluating data warehouses, we chose Amazon Redshift over Snowflake because of the transparent and predictable pricing,” says Peter Jamieson, Director of Analytics and Data Science at Poloniex. “The scalability and flexibility have been enormously valuable as we scale our analytics capability with a lean team and infrastructure. We benefit from the separation of compute and storage in the Amazon Redshift RA3 nodes because we have workflows that create a significant spike in our compute needs, especially when aggregating historical transaction data.”

Organizations are often looking to share the data and insight gained through analytics with their end-users as part of their product or service. The Software as a Service (SaaS) model enables this, and we work closely with SaaS customers to understand the value their data provides so they can use Amazon Redshift to unlock additional business value. Amazon Redshift is well positioned to build a scalable, multi-tenant SaaS solution with features that deliver consistent performance with multiple tenants sharing the same Amazon Redshift cluster.

OpenVault, a full-service technology solutions and data analytics company, enables cable, fiber, and mobile operators around the world to unlock the power of the data in their network to optimize and monetize their businesses. They shared a similar story:

“Amazon Redshift powers analytics in our SaaS solutions to provide insight that can be used to anticipate residential and business broadband trends,” says Tony Costa, EVP and CTO at OpenVault. “This makes it possible to use fast-growing broadband data to make decisions that result in revenue growth, new revenue streams, reduced operational/capital expenses, and improved quality of service for broadband operators. We chose Amazon Redshift RA3 because it is a cost-effective analytics and managed storage solution. It empowers OpenVault’s data scientists and operator customers to perform near real-time analysis of billions of rows of records and seamlessly evolve with the growing analytics needs and ad-hoc inquiries of our customers.”

If you’re new to Amazon Redshift, many resources are available to help you ramp up, including AWS employees and partners. For more information, see Getting Started with Amazon Redshift and Request Support for your Amazon Redshift Proof-of-Concept.

Duolingo, Social Standards, Yelp, Codecademy, and Nielsen get better performance and double the storage capacity at the same price by moving from Amazon Redshift DS2 to RA3

For years, customers with large data storage needs chose Amazon Redshift DS2 (Dense Storage 2) for its price-performance value. Customers such as NTT Docomo and Amazon.com ran petabyte-scale workloads in a single cluster on DS2 node types. However, as data size kept increasing exponentially, the amount of data actively being queried continued to become a smaller fraction of the total data size. You had to either keep adding nodes to store more data in the data warehouse, or retire data to Amazon S3 in a data lake. This creates operational overhead. With Amazon Redshift RA3, after the data is ingested in the cluster, it’s automatically moved to managed storage. RA3 nodes keep track of the frequency of access for each data block and cache the hottest blocks. If the blocks aren’t cached, the large networking bandwidth and precise storing techniques return the data in sub-seconds.

For customers like Duolingo, Social Standards, Yelp, and Codecademy, who are among the tens and thousands of customers already using Amazon Redshift, it’s easy to upgrade to RA3.

Duolingo is the most popular language-learning platform and the most downloaded education app in the world, with more than 300 million users. The company’s mission is to make education free, fun, and accessible to all. They upgraded from Amazon Redshift DS2 instances to the largest instance of RA3 to support their growing data.

“We use Amazon Redshift to analyze the events from our app to gain insight into how users learn with Duolingo,” says Jonathan Burket, a Senior Software Engineer at Duolingo. “We load billions of events each day into Amazon Redshift, have hundreds of terabytes of data, and that is expected to double every year. While we store and process all of our data, most of the analysis only uses a subset of that data. The new Amazon Redshift RA3 instances with managed storage deliver two times the performance for most of our queries compared to our previous DS2 instance-based Amazon Redshift clusters. The Amazon Redshift managed storage automatically adapts to our usage patterns. This means we don’t need to manually maintain hot and cold data tiers, and we can keep our costs flat when we process more data.”

For more information about how Duolingo uses Amazon Redshift, watch the session from AWS re:Invent 2019, How to scale data analytics with Amazon Redshift.

Amazon Redshift is designed to handle these high volumes of data that collectively uncover trends and opportunities. At Social Standards, a fast growing market analytics firm, Amazon Redshift powers the analytics that helps enterprises gain insights into collective social intelligence. The comparative analytics platform transforms billions of social data points into benchmarked insights about the brands, products, features, and trends that consumers are talking about.

“At Social Standards, we are creating the next generation of consumer analytics tools to discover and deliver actionable business insights with complete and authentic analysis of social data for strategic decision making, product innovation, financial analytics, and much more,” says Vladimir Bogdanov, CTO at Social Standards. “We use Amazon Redshift for near real-time analysis and storage of massive amounts of data. Each month we add around 600 million new social interactions and 1.2 TB of new data. As we look forward and continue to introduce new ways to analyze the growing data, the new Amazon Redshift RA3 instances proved to be a game changer. We moved from the Amazon Redshift DS2 instance type to RA3 with a quick and easy upgrade, and were able to increase our storage capacity by eight times, increase performance by two times, and keep costs the same.”

These performance and cost benefits also attracted the popular online reviews and marketplace company, Yelp, to upgrade from DS2 to RA3. Yelp’s mission is to connect people with great local businesses, and data mining and efficient data analysis are important in order to build the best user experience.

“We continue to adopt new Amazon Redshift features and are thrilled with the new RA3 instance type,” says Steven Moy, a Software Engineer at Yelp. “We have observed a 1.9 times performance improvement over DS2 while keeping the same costs and providing scalable managed storage. This allows us to keep pace with explosive data growth and have the necessary fuel to train our machine learning systems.”

For more information about how Yelp uses Amazon Redshift, watch the session from AWS re:Invent 2019, What’s new with Amazon Redshift, featuring Yelp.

As current health conditions shine a spotlight on online learning, many organizations are scaling and using data to guide decision-making. Codecademy uses Amazon Redshift to store all the growing data generated through customers’ use of their web application, including high-volume events such as page visits and button clicks. Their data science team uses this data to develop various statistical models, and by analyzing these models, improve the app based on how customers use it.

“Codecademy is an education company committed to teaching modern skills within technology and code, as well as a catalyst in the shift toward online learning,” says Doug Grove, Director of Infrastructure and Platform at Codecademy. “We were leveraging DS2.xls for our Amazon Redshift cluster and moved to RA3.4xls for performance gains. Moving to the RA3s resulted in a two times performance increase and cut data loading times in half. The separation of compute and storage allows us to scale independently, and allows for easier cluster maintenance.”

For many customers that started using a data warehouse on-premises and migrated to AWS, the scale and value of cloud continue to pay off. Nielsen, the global measurement and data analytics company, provides the most complete and trusted view of consumers and markets worldwide with operations in over 100 countries. A recent upgrade from DS2 to RA3 was the next step in their analytics journey, and helped them save costs, increase performance, and prepare for continued growth.

“We migrated from an on-premises data warehouse to Amazon Redshift in 2017 to optimize costs and to scale our solution to meet the growing demand,” says Sri Subramanian, Senior Manager of Technology at Nielsen. “Our data warehouse workloads run 24/7 at a scale of 1 billion rows per day. We recently migrated our Amazon Redshift cluster from DS2.8x to the new RA3.4x instance type. We have seen a performance gain of up to 40–50% on most of our workloads at a similar price point. Since the RA3 instance types separate compute and storage, disk utilization is no longer a concern. The upgrade was straightforward, and we went from proof of concept to solving complex business challenges quickly.”

These performance gains and productivity improvements are consistent themes from the feedback we’re getting from customers moving from DS2 to RA3. For more information about upgrading your workloads, see Overview of RA3 node types.

Rail Delivery Group, FiNC, and Playrix move from Amazon Redshift DC2 to RA3 to scale compute and storage independently for improved query performance and lower costs

Customers often chose DC2 (Dense Compute 2) for its superior query performance and low price. However, as the data sizes grew, clusters became bigger without the need for additional compute power. Many customers like Rail Delivery Group, FiNC, and Playrix are finding that by upgrading to RA3, they can get significantly more storage space and the same superior performance without increasing costs. For some use cases that need a large amount of raw computational power at the cheapest price and don’t require over 1 TB of data, DC2 provides industry-beating performance. However, if data is likely to grow to over 1 TB compressed, choosing RA3 node types and sizing for compute requirements is a much simpler and cheaper solution in the long run.

One company that found their storage needs growing faster than compute is Rail Delivery Group, a non-profit organization that brings together the companies that run Britain’s railway. They use Amazon Redshift to analyze rail industry data such as timetables, ticket sales, and smartcard usage.

“Since we started using Amazon Redshift for analytics in 2017, we have grown from 1 node to 10 nodes,” says Toby Ayre, Head of Data & Analytics at Rail Delivery Group. “Our data storage needs grew much faster than compute needs, and we had to keep unloading the data out of the data warehouse to Amazon S3. Now, with RA3.4xl nodes with managed storage, we can size for query performance and not worry about storage needs. Since we upgraded from a 10 node DC2.large cluster to a two node RA3.4xl cluster, our queries typically run 30% faster.”

Optimizing costs while also preparing for future growth are consistent requirements for our customers. For FiNC Technologies, the developer of the number one healthcare and fitness app in Japan, data drives a cycle of continuous improvement and enables them to deliver on their mission to provide personalized AI for everyone’s wellness. The personalized diet tutor, private gym, and wellness tracker app helps users make informed decisions about their health and well-being based on real-time metrics about their behavior.

“At FiNC Technologies, we rely on Amazon Redshift to manage KPIs to continuously improve our web services and apps,” says Komiyama, Kohei, a Data Scientist in FiNC. “We upgraded to the Amazon Redshift RA3 from DC2 because our storage needs were growing faster than our compute. We found it easy to upgrade, and like that our new data warehouse scales storage capacity automatically without any manual effort. Since upgrading, we’ve reduced operational costs by 70%, and feel prepared for future data growth.”

While FiNC optimized for growing storage, Playrix, one of the leading mobile game developers in the world, optimized for compute. With over $1 billion annual revenue and more than 2,000 global employees, Playrix builds popular games like Township, Fishdom, Gardenscapes, Homescapes, Wildscapes, and Manor Matters. They use data to better understand the customer journey.

“We rely on data from multiple internal and external sources to gain insight into user acquisition and make marketing decisions,” says Mikhail Artyugin, Technical Director at Playrix. “We moved our Amazon Redshift data warehouse from 20 nodes of DC2.xlarge to three nodes of RA3.4xl to future proof our system. We’re thrilled with the increase in computing power that makes it faster to deliver insight on the marketing data, and we have almost infinite storage space with managed storage, all for a reasonable price. The friendly and productive collaboration with AWS enterprise support and product team was an extra bonus.”

Conclusion

The Amazon Redshift RA3 nodes with managed storage deliver value to new customers like Poloniex and OpenVault, and to existing customers upgrading from DC2 and DS2 instances like Duolingo, Social Standards, Yelp, Codecademy, Nielsen, Rail Delivery Group, FiNC, and Playrix.

If you’re new to Amazon Redshift, check out our RA3 recommendation tool available on the AWS Management Console when you create a cluster. If you’re already an Amazon Redshift customer and you haven’t tried out RA3 yet, it’s easy to upgrade in minutes with a cross instance restore or elastic resize. If you have existing Amazon Redshift DC2 or DS2 Reserved Instances, you can contact us to get support with the upgrade. For more information about recommended RA3 node types and cluster sizes when upgrading from DC2 and DS2, see Overview of RA3 node types.

New features and capabilities for Amazon Redshift are released rapidly, and RA3 is set up for the new scale of data because with AQUA (Advanced Query Accelerator) for Amazon Redshift, performance will continue to improve. You can sign up for the preview of this innovative new hardware-accelerated cache, and the clusters running on RA3 will automatically benefit from AQUA when it’s released. We continue to innovate based on what we hear from our customers, so keep an eye on What’s New in Amazon Redshift to learn about our new releases.


About the authors

Corina Radovanovich leads product marketing for cloud data warehousing at AWS. She’s worked in marketing and communications for the biggest tech companies worldwide and specializes in cloud data services.

Himanshu Raja is a Principal Product Manager for Amazon Redshift. Himanshu loves solving hard problems with data and cherishes moments when data goes against intuition. In his spare time, Himanshu enjoys cooking Indian food and watching action movies.

Stream, transform, and analyze XML data in real time with Amazon Kinesis, AWS Lambda, and Amazon Redshift

$
0
0

Feed: AWS Big Data Blog.

When we look at enterprise data warehousing systems, we receive data in various formats, such as XML, JSON, or CSV. Most third-party system integrations happen through SOAP or REST web services, where the input and output data format is either XML or JSON. When applications deal with CSV or JSON, it becomes fairly simple to parse because most programming languages and APIs have direct support for CSV or JSON. But for XML files, we need to consider a custom parser, because the format is custom and can be very complex.

When systems interact with each other and process data through different pipelines, they expect real-time processing or availability of data, so that business decisions can be instant and quick. In this post, we discuss a use case where XMLs are streamed through a real-time processing system and can go through a custom XML parser to flatten data for easier business analysis.

To demonstrate the implementation approach, we use AWS cloud services like Amazon Kinesis Data Streams as the message bus, Amazon Kinesis Data Firehose as the delivery stream with Amazon Redshift data warehouse as the target storage solution, and AWS Lambda as record transformer of Kinesis Data Firehose, which flattens the nested XML structure with custom parser script in Python.

AWS services overview

This solution uses AWS services for the following purposes:

  • Kinesis Data Streams is a massively scalable and durable real-time data streaming service. It can continuously capture gigabytes of data per second from hundreds of thousands of sources, such as website click-streams, database event streams, financial transactions, social media feeds, IT logs, and location-tracking events. The data collected is available in milliseconds to enable real-time analytics use cases such as real-time dashboards, real-time anomaly detection, dynamic pricing, and more. We use Kinesis Data Streams because it’s a serverless solution that can scale based on usage.
  • Kinesis Data Firehose is the easiest way to reliably load streaming data into data lakes, data stores, and analytics tools. It can capture, transform, and load streaming data into Amazon Simple Storage Service (Amazon S3), Amazon Redshift, Amazon Elasticsearch Service (Amazon ES), and Splunk, enabling near-real-time analytics with existing business intelligence (BI) tools and dashboards you’re already using today. It’s a fully managed service that automatically scales to match the throughput of your data and requires no ongoing administration. It can also batch, compress, transform, and encrypt the data before loading it, minimizing the amount of storage used at the destination and increasing security. In our use case, our target storage layer is Amazon Redshift, so Kinesis Data Firehose fits great to simplify the solution.
  • Lambda is an event-driven, serverless computing platform provided by AWS. It’s a computing service that runs code in response to events and automatically manages the computing resources required by that code. Lambda supports multiple programming languages, and for our use case, we use Python 3.8. Other options include Amazon Kinesis Data Analytics with Flink, Amazon EMR with Spark streaming, Kinesis Data Firehose, or a custom application based on Kinesis consumer library. We use Kinesis Data Firehose as the consumer in this use case, with AWS Lambda as the record transformer, because our target storage is Amazon Redshift, which is supported by Kinesis Data Firehose.
  • Amazon S3 is an object storage service that offers industry-leading scalability, data availability, security, and performance. This means customers of all sizes and industries can use it to store and protect any amount of data for a range of use cases, such as websites, mobile applications, backup and restore, archive, enterprise applications, IoT devices, and big data analytics. For our use case, we use Amazon S3 as an intermediate storage before loading to the data warehousing system, so that it’s fault tolerant and provides better performance while loading to Amazon Redshift. By default, Kinesis Data Firehose requests an intermediate S3 bucket path when Amazon Redshift is the target.
  • Amazon Redshift is a fast, fully managed data warehouse that makes it simple and cost-effective to analyze all your data using standard SQL and your existing BI tools. In our use case, we use Amazon Redshift so that BI tools like Amazon QuickSight can easily connect to Amazon Redshift to build real-time dashboards.

Architecture overview

The following diagram illustrates the simple architecture that you can use to implement the solution.

The architecture includes the following components:

  • The Amazon Kinesis Producer Library (KPL) represents the system that pushes data to Kinesis Data Streams. It can be a simple Amazon Elastic Compute Cloud (Amazon EC2) machine or your local windows command line that executes the Kinesis Data Streams command line interface (CLI) to push messages. Alternatively, it can be a dynamic application that uses Kinesis Data Streams APIs or KPL to push messages dynamically. For our use case, we spin up an EC2 instance through AWS Cloud9 and use Kinesis Data Streams CLI commands to publish messages.
  • Kinesis Data Streams receives messages against a partition key from the publisher and waits for consumers to consume it. By default, the retention period of the messages in Kinesis Data Streams is 24 hours, but you can extend it to 7 days.
  • Kinesis Data Firehose takes a few actions:
    • Consumes data from Kinesis Data Streams and writes the same XML message into a backup S3 bucket.
    • Invokes a Lambda function that acts as a record transformer. Lambda receives input as XML, applies transformations to flatten it to be pipe-delimited content, and returns it to Kinesis Data Firehose.
    • Writes the pipe-delimited content to another S3 bucket, which acts as an intermediate storage bucket before writing into Amazon Redshift.
    • Invokes the Amazon Redshift COPY command, which takes pipe-delimited data from the intermediate S3 bucket and writes it into Amazon Redshift.
  • Data is inserted into the Amazon Redshift table, which you can query for data analysis and reporting.

Solution overview

To implement this solution, you complete the following steps:

  1. Set up the Kinesis data stream as the message bus.
  2. Set up KPL, which publishes sample XML message data to Kinesis Data Streams.
  3. Create an Amazon Redshift cluster, which acts as target storage for the Firehose delivery stream.
  4. Set up the delivery stream, which uses Lambda for record transformation and Amazon Redshift as target storage.
  5. Customize a Lambda function script that converts the nested XML string to a flat pipe-delimited stream.

Prerequisites

Before beginning this tutorial, make sure you have permissions to create Kinesis data streams and publish messages to the streams.

Setting up your Kinesis data stream

You can use the AWS Management Console to create a data stream as a one-time activity. You can configure the cluster capacity as per your requirement, but start with the minimum and apply auto scaling as the data volume increases. Auto scaling is based on Amazon CloudWatch metrics. For more information, see Scale Amazon Kinesis Data Streams with AWS Application Auto Scaling.

Setting up KPL

For this use case, we use the AWS Cloud9 environment IDE, where through the Linux command line, we can execute Kinesis Data Streams CLI commands to publish sample XML messages. The following code shows an example XML of an employee record that has one-level nesting for the all_addresses attribute:

aws kinesis put-record --stream-name <Stream-Name> --data "<employees><employee><first_name>FName 1</first_name><last_name>LName 1</last_name><all_address><address><type>primary</type><street_address>Street Address 1</street_address><state>State 1</state><zip>11111</zip></address><address><type>secondary</type><street_address>Street Address 2</street_address><state>State 2</state><zip>11112</zip></address></all_address><phone>111-111-1111</phone></employee><employee><first_name>FName 2</first_name><last_name>LName 2</last_name><all_address><address><type>primary</type><street_address>Street Address 3</street_address><state>State 3</state><zip>11113</zip></address><address><type>secondary</type><street_address>Street Address 4</street_address><state>State 4</state><zip>11114</zip></address></all_address><phone>111-111-1112</phone></employee></employees>" —partition-key <partition-key-name>

You need to change the stream name, XML data, and partition key in the preceding code as per your use case. Also, instead of an AWS Cloud9 environment, you have additional ways to submit messages to the data stream:

  • Use an EC2 instance to execute the Kinesis Data Streams CLI command
  • Use KPL or Kinesis Data Streams APIs in any programming language to submit messages dynamically through your custom application

Creating an Amazon Redshift cluster

In this step, you create an Amazon Redshift cluster that has required permissions and ports open for Kinesis Data Firehose to write to it. For instructions, see Controlling Access with Amazon Kinesis Data Firehose.

Make sure the cluster has the required port and permissions so that Kinesis Firehose can push data into it. Also make sure the table schema you create matches your pipe-delimited format that Lambda creates as output and Kinesis Data Firehose uses it to write to Amazon Redshift.

Setting up the delivery stream

When you create your Kinesis Data Firehose delivery stream on the console, define the source as Kinesis Data Streams, the target as the Amazon Redshift cluster, and enable record transformation with Lambda.

To complete this step, you need to create an AWS Identity and Access Management (IAM) role with the following permissions for the delivery stream:

  • Read permissions from the data stream
  • Write permissions to the intermediate S3 bucket
  • Write permissions to the defined Amazon Redshift cluster

Define the following configurations for the delivery stream:

  • Enable the source record transformation, where you selected your Lambda function.

  • As an optional step, you can enable source record backup, which saves the source XML to the S3 bucket path you define.

  • Define the intermediate S3 bucket, which you use to store transformed pipe-delimited records and later use for the Amazon Redshift copy.

  • In your Amazon Redshift configurations, for COPY options, make sure to specify DELIMITER ‘|’, because the Lambda function output is pipe delimited and Kinesis Data Firehose uses that in the Amazon Redshift copy operation.

Customizing the Lambda function

This function is invoked through Kinesis Data Firehose when the record arrives in Kinesis Data Streams.

Make sure you increase the Lambda execution timeout to more than 1 minute. See the following code:

from __future__ import print_function

import base64
import json
import boto3
import os
import time
import csv 
import sys

from xml.etree.ElementTree import XML, fromstring
import xml.etree.ElementTree as ET

print('Loading function')


def lambda_handler(event, context):
    output = []

    for record in event['records']:
        payload = base64.b64decode(record['data'])
        parsedRecords = parseXML(payload)
        
        # Do custom processing on the payload here
        output_record = {
            'recordId': record['recordId'],
            'result': 'Ok',
            'data': base64.b64encode(parsedRecords)
        }
        output.append(output_record)

    print('Successfully processed {} records.'.format(len(event['records'])))
    return {'records': output}
    
    
def parseXML(inputXML):
    xmlstring =  str(inputXML.decode('utf-8'))
    
    # create element tree object
    root = ET.fromstring(str(xmlstring))
    #print("Root Tag"+root.tag)
    
    # create empty list for items 
    xmlItems = ""
  
    # iterate over employee records
    for item in root.findall('employee'):
       #print("child tag name:"+item.tag+" - Child attribute")
       
       # Form pipe delimited string, by concatenating XML values
       record = item.find('first_name').text + "|" + item.find('last_name').text + "|" + item.find('phone').text
       
       primaryaddress = ""
       secondaryaddress = ""
       
       # Get primary address and secondary address separately to be concatenated to the original record in sequence
       for addressitem in item.find('all_address').findall('address'):
           if(addressitem.find('type').text == "primary"):
               primaryaddress = addressitem.find('street_address').text + "|" + addressitem.find('state').text + "|" + addressitem.find('zip').text
           elif(addressitem.find('type').text == "secondary"):
               secondaryaddress = addressitem.find('street_address').text + "|" + addressitem.find('state').text + "|" + addressitem.find('zip').text
               
       #print("Primary Address:"+primaryaddress)
       #print("Secondary Address:"+secondaryaddress)
       
       record += "|" + primaryaddress + "|" + secondaryaddress + "n"
       xmlItems += record
       #print("Record"+record)
    
    #print("Final Transformed Output:"+xmlItems)
    return xmlItems.encode('utf-8')

You can customize this example code to embed your own XML parser logic. Keep in mind that, while using the function, the request and response (synchronous calls) body payload size can be up to 6 MB, so it’s important to make sure the return value isn’t increased over that limit.

Your Amazon Redshift table (employees) has respective fields to capture the flattened pipe-delimited data. Your query might look like the following code to fetch and read the data:

SELECT first_name, last_name, phone, primary_address_street, primary_address_state, primary_address_zip, secondary_address_street, secondary_address_state, secondary_address_zip
FROM employees

The following screenshot shows the result of the query in the Amazon Redshift query editor.

Debugging

While setting up this framework in your development environment, you can debug individual components of the architecture with the following guidelines:

  • Use the Kinesis Data Streams Monitoring tab to validate that it receives messages and read operations are happening through the consumer (Kinesis Data Firehose). You can also use Kinesis Data Streams CLI commands to read from the stream.
  • Use the Kinesis Data Firehose Monitoring tab to check if it receives messages from Kinesis Data Streams and can push them to Amazon Redshift. You can also check for errors on the Error logs tab or directly on the Amazon CloudWatch console.
  • Validate Lambda with a test execution to check that it can transform records to pipe-delimited formats and return to Amazon Data Firehose with the expected format (base64 encoded format).
  • Confirm that the S3 intermediate storage bucket has the transformed record and doesn’t write into failed processing or error record paths. Also, check if the transformed records are pipe delimited and match the schema of the target Amazon Redshift table.
  • Validate if the backup S3 bucket has the original XML format records. If Lambda or the delivery stream fails, you have an approach to manually reprocess it.
  • Make sure Amazon Redshift has the new data records reflecting through SQL SELECT queries and check the cluster’s health on the Monitoring

Conclusion

This post showed you how to integrate real-time streaming of XML messages and flatten them to store in a data warehousing system for real-time dashboards.

Although you followed individual steps for each service in your development environment, for a production setup, consider the following automation methods:

  • AWS CloudFormation allows you to embed infrastructure as code that can spin up all required resources for the project, and you can easily migrate or set up your application in production or other AWS accounts.
  • A custom monitoring dashboard can take input from each AWS service you use through its APIs and show the health of each service with the number of records being processed.

Let us know in the comments any thoughts of questions you have about applying this solution to your use cases.


About the Author

Sakti Mishra is a Data Lab Solutions Architect at AWS. He helps customers architect data analytics solutions, which gives them an accelerated path towards modernization initiatives. Outside of work, Sakti enjoys learning new technologies, watching movies, and travel.

Amazon Interactive Video Service adds support for playback authorization

$
0
0

Feed: Recent Announcements.

When playback authorization is enabled for a channel, only playback requests with valid authorization tokens will be served the video playlist. You can use the Amazon IVS API to generate an asymmetric key pair and view and manage the active key pairs in your account. This key pair allows you to create and sign authorization tokens, and deliver these tokens to the intended viewers, who will attach them to a playback request to Amazon IVS. By deleting a key pair, you revoke all authorization tokens generated from it, allowing you to maintain control over who can access your video playlists. 

To get started, instructions for configuring playback authorization for your live channels are available on the documentation pages.

Amazon Interactive Video Service (Amazon IVS) is a managed live streaming solution that is quick and easy to set up, and ideal for creating interactive video experiences. Send your live streams to Amazon IVS using standard streaming software like Open Broadcaster Software (OBS) and the service does everything you need to make low-latency live video available to any viewer around the world, letting you focus on building interactive experiences alongside the live video.

The Amazon IVS console and APIs for control and creation of video streams are available in the US East (N. Virginia), US West (Oregon), and Europe (Ireland) regions. Video ingest and delivery are available around the world over a managed network of infrastructure optimized for live video. 

How Infiswift Supercharged Its Analytics for IoT & AI Applications

$
0
0

Feed: MemSQL Blog.
Author: Floyd Smith.

Infiswift uses AI to help meet real-world challenges, largely through Internet of Things (IoT) deployments. They optimize the operation of physical devices using connectivity and data. The company’s innovative platform makes it easy to connect and manage any number of endpoints at scale, with security, and to build solutions that open new services or improve existing ones. Infiswift empowers its customers to be data-driven in industries such as renewable energy, agriculture, and manufacturing. Infiswift has chosen MemSQL as the real-time insights engine of its platform to deliver fast, reliable analytics, and to power constantly updated machine learning (ML) models. We’ve updated this blog post with fresh insights from our recent interview with Infiswift CTO Jay Srinivasan.

The Impact of Device Insights

The Infiswift platform reliably and securely ingests data from any endpoint, combining scalability and simplicity, a combination which most IoT environments struggle to deliver. The platform delivers real-time insights across streams of data as they enter the system. Operators use the data to improve equipment reliability and optimize costs. 

The platform uses the MQTT protocol at the core of a sophisticated publish-subscribe mechanism, including multi-level, hierarchical security protection, down to the level of an individual data point. A key ingredient to the analytics system is the need for an adaptable database platform that can manage fast ingestion of intermittent data. Infiswift has found the platform they need: MemSQL.

infiswift-architecture

Real-Time and Historical Data for IoT Systems

IoT systems access millions of devices that generate large amounts of streaming data. For some equipment, a single event may prove critical to understanding and responding to the health of the machine in real time, increasing the importance of accurate, reliable data. While real-time data remains important, storing and analyzing the historical data also unveils opportunities for new optimizations and operating techniques. The combination of both real-time and historical data provides the most complete view for the IoT platform.

Database Requirements for IoT

Business demands put extra pressure on the Infiswift platform to process data quickly, including device authentication and state. Equipment messages come at intervals of seconds or subseconds, driving the requirement for a high-throughput, memory-optimized database. The engineering team needed a database to rapidly ingest changing data, while also persisting to disk for long-term analysis. Because of the large data volumes, the database needs to optimize disk resources by leveraging columnstore data compression.

“We need the data to be processed extremely rapidly, basically in real time. We chose MemSQL because we needed a high-throughput database that can handle our data volumes and velocity with the reliability our customers require.” – Jay Srinivasan

MemSQL Advantages

The Infiswift team needed a database platform that could handle the scale of ingesting and analyzing millions of events in real time. After several technology evaluations, the team chose MemSQL.

“It’s a really well-thought-out product; that’s why I love it.” 

Rowstore and Columnstore for Optimal Performance

The unique combination of an in-memory rowstore engine with a memory and disk-based columnstore made for efficient processing and a simplified architecture. 

“We wanted to store lots of sensor data, so obviously that will be disk-based storage. But at the same time, we wanted the platform to be fast for real-time data distribution, which means in-memory.” 

JSON Support

MemSQL was an early leader in making JSON data a first-class data type within a relational database, making it fast and easy to run SQL commands against semi-structured JSON data. JSON data is fundamental to IoT, so this capability is critical to Infiswift. 

Scalable Transactions

The application requires transactional consistency to deliver highly accurate updates for constantly changing sensor events. Infiswift could not get what it needed from NoSQL-based solutions; the speed and compatibility of SQL were vital to them. 

“We need a platform that can support these high-energy, high-frequency transactions… we take only 24ms. to complete the round trip.” 

Relational SQL

The Infiswift engineering team has an investment in ANSI SQL, along with MySQL, for app development. MemSQL ensures existing technology commitments could remain intact. In particular, MemSQL is compatible with MySQL wire protocol, making it easy to use MemSQL as a drop-in replacement. 

“At the end of my time at Google, we were moving to Google Spanner, which is actually a SQL-based interface.” 

Compression

The large amount of data collected required sophisticated compression to maximize server resources. MemSQL provides compression of roughly 7x for the application.

AI/ML Integration

AI is a key part of Infiswift’s value proposition, and MemSQL provides fast, simultaneous access to both new, streaming data and historical data, as needed for AI. In particular, Infiswift needs to update machine learning models, running within a Spark framework, in real time – and MemSQL readily supports Spark integration

“For our machine learning models… in the training phase, our workload runs directly against the same MemSQL cluster that also provides us analytics support and 7x compression for columnstore data.” 

Licensing and Deployment Flexibility

MemSQL offers a free edition that allows innovative, fast-moving startups like Infiswift to build and scale. Infiswift is able to flexibly move from MemSQL on-premises, MemSQL in the cloud, and MySQL deployments for small accounts. 

“MemSQL has the ability to be completely hostable on-premises for us. It’s not just a matter of moving across clouds; it’s one of our most important requirements, that we also be able to host completely on-prem. MeMSQL is hostable anywhere we want.” 

Conclusion

Infiswift was looking to meet four key requirements, not expecting to find a single product that could offer all of them: 1. an in-memory rowstore, 2. on-disk columnstore with compression, 3. SQL support, and 4. availability both on-premises and in the cloud. Not only has MemSQL met all these requirements, with excellent performance; it has also provided two additional capabilities that proved to be important: support for JSON, which is used my nearly all modern IoT devices; and MySQL wire protocol compatibility, which makes MemSQL a drop-in replacement for MySQL, without changing application code. 

Building IoT applications involves a balance of technology to enable the scale, security, and performance for operational requirements. The Infiswift platform eliminates complexity and delivers on the promise of a high-performance IoT system that can efficiently enable data-driven operations. Now, with MemSQL, each application built on the platform has the reliability and performance that customers require to drive transformational analytics, machine learning, and AI for their operations.

To learn more about MemSQL for IoT applications, try MemSQL for free or contact MemSQL.

IoT Solution Overview

MemSQL for Energy Applications

Sample demo application for monitoring wind turbines

How to Create Notification Services with Redis, WebSockets, and Vue.js

$
0
0

Feed: Redis Labs.
Author: Tugdual Grall.

It is very common to get real-time notifications when navigating in a web application. Notifications could come from a chat bot, an alerting system, or be triggered by an event that the app pushes to one or more users. Whatever the source of the notifications, developers are increasingly using Redis to create notification services.

In modern applications powered by a microservices architecture, Redis is often used as a simple cache and as a primary database. But it is also used as a communication layer between services using a persistent messaging layer powered by Redis Streams, a lightweight eventing system using its well-known Pub/Sub (Publish/Subscribe) commands.

In this blog post, we’ll show you how easy it is to create a small notification service using Redis Pub/Sub to send messages to a web application, developed with Vue.js, Node.js, and WebSockets.

Here’s how the notifications work. For a higher-resolution version, click on this gif to see the video.

Prerequisites

This demo service uses:

Starting Redis server

If you do not have already a Redis instance running, you can start it using Docker; in a terminal, run this command:

> docker run -it --rm --name redis-server -p 6379:6379 redis

Redis should now be up and running and ready to accept connections.

Creating the WebSocket server with Node.js

To configure the project with the proper structure, open a terminal and enter the following commands:

Create a new Node.js project using npm (the -y parameter will set all values to the default one):

The final command above adds the WebSocket and Redis dependencies to your project. You are now ready to write some code!

Writing the WebSocket server

Open your favorite code editor for Node.js (I use Visual Studio Code) and simply enter the code “code .” to open the current directory. In your editor, create a new file called server.js.

This simple Node.js program is limited to the demonstration and focuses on:

  • Connecting to Redis (line 9)
  • Subscribing to the messages from the “app:notifications” channel (line 10)
  • Starting a WebSocket server (line 13)
  • Registering user client connections (line 16)
  • Listening to Redis subscribe events (line 19)
  • And sending the message to all WebSocket clients (21).

Lines 5 and 6 are simply used to configure the Redis server location and the port to use for the Web Socket server. As you can see it is pretty simple.

Running the WebSocket server

If you have not yet installed nodemon, install it now. Then start the WebSocket server using the following command:

Let’s now create the frontend that will receive the notifications and print them to the user.

Creating the frontend with Vue.js

Open a new terminal and run the following command from the notifications directory:

If you have not already installed the Vue CLI tool already, do so now using the command npm install -g @vue/cli.

This command creates a new Vue project that is ready to be executed and extended.

One last package to install for this demonstration is BootstrapVue, which makes it easy to use the CSS library and components from the popular Bootstrap framework.

Open the web-client directory in your favorite code editor, then start the newly created Vue application:

The last command starts the Vue development server that will serve the pages and also automatically reloads the pages when you change them.

Open your browser, and go to http://localhost:8080; where you should see the default Vue welcome page:

Adding WebSocket to the frontend

The Vue framework is quite simple, and for this post we will keep the code as simple as possible. So let’s quickly look at the directory structure:

├── README.md
├── babel.config.js
├── node_modules
├── package-lock.json
├── package.json
├── public
│   ├── favicon.ico
│   └── index.html
└── src
    ├── App.vue
    ├── assets
    │   └── logo.png
    ├── components
    │   └── HelloWorld.vue
    └── main.js

The files at the root level (babel.config.js, package.json, package-lock.json, node_modules) are used to configure the project. The most interesting part, at least for now, is located in the src directory:

  • The main.js file is the main JavaScript file of the application, which will load all common elements and call the App.vue main screen. We will modify it later to add Bootstrap support.
  • The App.vue is a file that contains in the HTML, CSS, and JavaScript for a specific page or template. As an entry point for the application, this part is shared by all screens by default, so it is a good place to write the notification-client piece in this file.

The public/index.htmlis the static entry point from where the DOM will be loaded. If you look at it you will see a <div id=”app”>, which is used to load the Vue application.

This demonstration is quite simple, and you will have to modify only two files: the App.vue and main.js files. In a real-life application, you would probably create a Vue.js component that would be reused in various places.

Updating the App.vue file to show WebSocket messages

Open the App.vue file in your editor and add the information listed below. At the bottom of the page, just before the </div> tag, add the following HTML block:

Using {{message}} notation, you are indicating to Vue to print the content of the message variable, which you will define in the next block.

In the <script>, replace the content with:

These few lines of code are used to:

  • Connect to the WebSocket server (line 13)
  • Consume messages from the server and send them the local message variable (lines 13-17)

If you look carefully at what has been changed, you can see that you have added:

  • A data() function that indicates to the Vue component that you are defining local variables that can be bound to the screen itself (lines 6-10)
  • A created() function that is called by the Vue component automatically when it is initialized

Sending messages from Redis to your Vue application

The WebSocket server and the Vue frontend should now be running and connected thanks to the few lines of JavaScript you added. It’s time to test it!

Using the Redis CLI or RedisInsight, publish some messages to the app:notifications channel. For example, if you started Redis using Docker, you can connect to it using the following command and start publishing messages:

You should see the message appear at the bottom of the application in your browser:

A Redis message displayed in the view application.

As you can see, it is pretty easy to push content to your web frontend in real time using WebSocket. So now lets improve the design and add a more user-friendly interface using Bootstrap.

Creating an alert block with Bootstrap

In this section, we’ll show you how to use a Bootstrap alert component, which appears when a new message is received and disappears automatically after a few seconds, using a simple countdown.

Main.js file

Open the main.js file and add the following lines after the last import:

These four lines import and register the Bootstrap components in your Vue application.

App.js file

In the App.vue file, replace the code you added earlier (everything between the two <hr/> tags and the tags themselves) with the following:

This component uses several attributes:

  • id=”notification”is the element id used to reference the element in JavaScript or CSS code:show=”dismissCountDown” indicates that the component is visible only when the dismissCountDown variable is not null nor 0
  • dismissible adds a small icon in the alert to let the user manually close it
  • @dismissed=”dismissCountDown=0″ shows that the alert box will be closed then the value dismissCountDown equals 0
  • @dismiss-count-down=”countDownChanged” is the countdown method

Let’s add a few lines of JavaScript to define the variables and methods used by the alert component:

In this section you have:

  • Added the dismissSecs and dismissCountDown and variables to the data() method (lines 4-5) that are used to control the timer that shows the alert before hiding it again
  • Created methods to show and hide the alert component (line 10-26)
  • Called the showAlert() method when a new message is received (line 13)

Let’s try it!

Go back to redis-cli or Redis Insight and post new messages to the app:notifications channel.

The notification in an alert box visible in the Vue application.

As you can see, it is easy to use Redis to create a powerful notification service for your application. This sample is pretty basic, using a single channel and server and broadcasting to all the clients.

The goal was really to provide an easy way to start with WebSocket and Redis Pub/Sub to push messages from Redis to a web application. There are many options to deliver messages to specific clients using various channels, and to scale and secure the application. 

You can also use the WebSocket server in the other direction, to consume messages as well as to push messages to clients. But that’s a big topic for another blog post. In fact, stay tuned for more blog posts on how you can use Redis Gears to easily capture events directly in the Redis database and push some events to various clients.

For more information, see these resources:

Streaming Percona XtraBackup for MySQL to Multiple Destinations

$
0
0

Feed: Planet MySQL
;
Author: MySQL Performance Blog
;

Percona XtraBackup for MySQL to Multiple DestinationsHave you ever had to provision a large number of instances from a single backup? The most common use case is having to move to new hardware, but there are other scenarios as well. This kind of procedure can involve multiple backup/restore operations which can easily become a pain to administer. Let’s look at a potential way to make it easier using Percona Xtrabackup. The Percona XtraBackup tool provides a method of performing fast and reliable backups of your MySQL data while the system is running.

Leveraging Named Pipes

As per the Linux manual page, a FIFO special file (a named pipe) is similar to a pipe except that it is accessed as part of the filesystem. It can be opened by multiple processes for reading or writing.

For this particular case, we can leverage FIFOs and netcat utility to build a “chain” of streams from one target host to the next.

The idea is we take the backup on the source server and pipe it over the network to the first target. In this target, we create a FIFO that is then piped over the network to the next target. We can then repeat this process until we reach the final target.

Since the FIFO can be read by many processes at the same time, we can use it to restore the backup locally, in addition to piping it over to the next host.

Implementation

In order to perform the following operations, we need the netcat, percona-xtrabackup and qpress packages installed.

Assume we have the following servers:

  • source, target1, target2, target3, target4

We can set up a “chain” of streams as follows:

  • source -> target1 -> target2 -> target3 -> target4

Looking at the representation above, we have to build the chain in reverse order to ensure the “listener” end is started before the “sender” tries to connect. Let’s see what the process looks like:

  1. Create listener on the final node that extracts the stream (e.g. target4):


    Note: the -p argument specifies the number of worker threads for reading/writing. It should be sized based on the available resources.

  2. Setup the next listener node. On target3:

  3. Repeat step 2 for all the remaining nodes in the chain (minding the order).
    On target 2:


    On target 1:


    Note that we can introduce as many intermediate targets as we need.

  4. Finally, we start the backup on the source, and send it to the first target node:


    If we got it right, all servers should start populating the target dir.

Wrapping Up

After the backup streaming is done, we need to decompress and recover on each node:

Also, adjust permissions and start the restored server:

Conclusion

We have seen how using named pipes, in combination with netcat, can make our lives easier when having to distribute a single backup across many different target hosts. As a final note, keep in mind that netcat sends the output over the network unencrypted. If transferring over the public internet, it makes sense to use Percona XtraBackup encryption, or replace netcat with ssh.

API Gateway HTTP APIs adds integration with five AWS services

$
0
0

Feed: Recent Announcements.

Customers can now create Amazon API Gateway HTTP APIs that route requests to AWS AppConfig, Amazon EventBridge, Amazon Kinesis Data Streams, Amazon SQS, and AWS Step Functions. With these new integrations, customers can easily create APIs and webhooks for their business logic hosted in these AWS services. 


Writing your input, to your Output, in Alteryx

$
0
0

Feed: The Information Lab.
Author: Ben Moss.

Writing your input, to your Output, in Alteryx

Both examples highlighted in this blog can be downloaded here.

In recent months, we’ve started delivering some Alteryx training to some of our customers around the idea of documentation best practices.

In one of these sessions we were asked about whether we can create an audit trail of the data process to a user whom doesn’t have an Alteryx Designer license.

There’s clearly quite a few ways this can be done, but the user specifically wanted to understand how they can write their original input data, to the same file as where their output data is stored.

The answer to this question is yes (with one caveat, your output file type must support multiple tables, cough, Excel, cough).


The process of implementing this is a fairly straightforward process, you just may have to use one tool that you haven’t used before, the “Block Until Done” tool, which forms part of the developer tool palette.

Let’s take this extremely simple workflow. We have some transactional sales data and we are using Alteryx to clean it so that it can be used by other stakeholders.

It might be nice for our stakeholders to understand what the original data looked like, as they may want to verify the transformations that we have made.

The above workflow demonstrates the process that allows us to achieve this. We insert a “Block Until Done” tool after our input, we then connect an output data tool to the ‘1’ output anchor (configured too write to the same file as the output, just to a different sheet), and then connect our downstream processes to the ‘2’ output anchor.

The purpose of the “Block Until Done” tool here is to prevent downstream processes occurring into the input data has been written to our output file. If we did not have the Block Until Done it is possible that both outputs may try and write to the our output file at the same time, causing an error.

The really key configuration here is actually within each of the output data tools.

We must choose the output option “Overwrite Sheet”. This prevents the whole file being destroyed and recreated with each of our output data tools. THIS SHOULD BE DONE FOR ALL OUTPUTS.

Once you’ve done this, and you run your workflow you should notice your output file now has multiple tabs!


An extension of this challenge is a ‘multi input’ workflow. Here we have the problem of having separate streams, which may be executing simultaneously.

We can manage this with the introduction of a 2nd tool, which again you may not have used before, the “Parallel Block Until Done” tool which forms part of the CReW macro pack.


The final extension that I’d like to highlight is how this method can be used to create visibility of our data at any point in our process in our output file. Lets say, for example, that we want to take our data after we’ve created our profit field, and include that in our output. This can be done with exactly the same method as that shown in the first example, we simply bring in in a further “Block Until Done” and output tool, and place that at whatever point we would like.

You get the idea…

Ben

How Epsagon Increased Performance on AWS Lambda by 65% and Reduced Cost by 4x

$
0
0

Feed: AWS Partner Network (APN) Blog.
Author: James Bland.

By James Bland, Sr. Partner Solutions Architect, DevOps at AWS
By Ran Ribenzaft, AWS Serverless Hero, CTO & Co-Founder at Epsagon

Providing a better experience at lower cost is the desired result of any organization and product. In most cases, it requires software re-architecting, planning, infrastructure configurations, benchmarking, and more.

Epsagon provides a solution for monitoring and troubleshooting modern applications running on Amazon Web Services (AWS).

The entire stack of Epsagon leverages the AWS serverless ecosystem such as AWS Lambda functions, Amazon DynamoDB, Amazon Simple Notification Service (SNS), Amazon Simple Queue Service (SQS), AWS Fargate, and more.

Epsagon is an AWS Partner Network (APN) Advanced Technology Partner with AWS Competencies in Data & Analytics, DevOps, AWS Containers, and Retail.

In this post, we share some of the best practices Epsagon has developed to improve the performance and reduce the cost of using serverless environments.

Understanding Performance and Cost

In AWS Lambda functions, cost equals performance. The main pricing factors are the number of requests and the GB-second duration. The GB-second duration is calculated from the time your code begins executing until it returns or otherwise terminates, rounded up to the nearest 100ms, multiplied by the memory configuration.

For example, a quick calculation on a 128MB function that runs for 1,600 ms results in $0.000003332 per invocation. When this function is running a million times a day, it results in a charge of $99 per month. If it runs 20 million times a day, it results in a charge of $1999 per month. That’s a price to start thinking about.

If we improved the performance of that 128MB function by 600ms, it would save $749 per month. That’s a savings of 37 percent. We have a strategy to make that happen.

Optimizing Performance and Cost

Let’s begin with Epsagon’s busiest AWS Lambda function: the logs parser. This function is responsible for analyzing close to one million Lambda function logs and converting them into metrical data and alerts. This function looks for common patterns in logs such as ‘REPORT’ lines, ‘Task timed out,’ and more.

Today, this service handles tens of billions of logs per day. To improve its performance and reduce cost, Epsagon built the following resilient pipeline.

Epsagon-Lambda-Costs-1

Figure 1 – Pipeline for Epsagon log parser.

These are the major components of the pipeline:

  • The AWS CloudWatch Log Groups subscribe to an Amazon Kinesis Data Stream on our account.
  • A log group is a group of log streams that share the same retention, monitoring, and access control settings. The data stream continuously captures gigabytes of data per second from hundreds of thousands of sources such as website clickstreams, IT logs, and more.
  • The Amazon Kinesis Data Stream service triggers the Lambda function to parse the gigabytes of data it has collected.
  • The Lambda function gets enriched data from Amazon DynamoDB (data is pre-populated by an async process).
  • The Lambda function stores the invocation data (transformed into metrical data) into Amazon Relational Database Service (Amazon RDS).

Before we begin, we need to know what our current performance benchmark and costs are. Using Epsagon, we can easily spot the log parser as our most expensive function.

Epsagon-Lambda-Costs-2

Figure 2 – Starting performance benchmark and cost.

To optimize both the performance and cost of our log parser, we employed these techniques:

  • Batching
  • Caching
  • Set SDK-keepalive to true
  • Initialize connections outside of the handler
  • Tuning memory configuration.

Batching

A great way to significantly improve performance in pipelines such as the log parser is to batch and group data together to minimize the number of invocations. In our log parser, we found three types of invocations we can batch:

  • Amazon Kinesis to AWS Lambda trigger batch size.
  • Calls to Amazon DynamoDB.
  • Calls to Amazon RDS.

We tested different batch sizes, and found out that by increasing Amazon Kinesis Data Stream batch size from 10 to 200 records, we retained almost the same duration. However, since we had much bigger chunks of data, we incurred fewer invocations.

Epsagon-Lambda-Costs-3

Figure 3 – Increasing KDS batch size reduced the number of invocations.

Since we were now handling bigger batches, we did not separately query the data of each record from DynamoDB. Instead, we used the batch_get_item call at the beginning of the process. It returns, in a single call, the enriched data for all the records.

For example:

def get_functions_data(rows):
    function_ids = [{'function_id': row.function_id} for row in rows]
    response = dynamodb.batch_get_item(
        RequestItems={
            'functions': {'Keys': function_ids}
        }
    )
    return response['Responses']

Instead of storing the processed rows into the PostgreSQL RDS database individually, we batched them all into one INSERT CALL.

The combination of both optimizations, the use batch_get_item and a single INSERT call, saved us about 400ms of invocations, on average. With very few changes in code and one configuration parameter, we reduced our number from about ~1400ms to 1000ms of invocations.

Caching

When using an external data source, caching the data locally can make a lot of sense. If the data is accessed often, as it is by DynamoDB in our log parser, local copies can improve performance and reduce costs. Of course, local caching makes sense only if the data is not constantly changing at very fast intervals.

To implement simple caching in our log parser, we set an item in the cache by using the following pattern in Python:

Import time
CACHE = {}
def set_cached_value(key, value):
    CACHE[key] = {
        "value": value,
        "timestamp": time.time(),
    }

The CACHE function gets the key and the value to set in our cache, and appends the timestamp that fed into the cache.

Now, let’s look on how to retrieve data from the cache:

TTL = 3600
def get_cached_value(key):
    item = CACHE.get(key)
    # Key doesn't exist.
    if not item:
        return None
    # TTL expired.
    if time.time() - item["timestamp"] > TTL:
        CACHE.pop(key)
        return None
    return item["value"]

Using these lines of Python code, we can implement local caching with a time-to-live (TTL) for each item. For our log parser, we selected 3600 seconds, or one hour. Our cached data can be shared by the same instance of Lambda invocation. It’s not shared between parallel instances, and newly initialized instances.

This approach reduces the number of calls to DynamoDB by 30 percent. It also reduces our average DB-second duration by another 100ms.

Set SDK keepalive to True

In some aws-sdk (or boto3) libraries, the default HTTP connection to AWS resources is set to ‘connection: close.’ It means that after every call, the connection is closed, and upon a new request, the whole handshake process starts from scratch.

In Python, you can do that from the configuration file. For example, your Python `~/.aws/config` file should look like this:

[default]
region = us-east-1
tcp_keepalive = true

You can do the same in Node.js functions by adjusting the code that initializes aws-sdk:

const AWS = require('aws-sdk')
const https = require('https');
const agent = new https.Agent({
  keepAlive: true
})

AWS.config.update({
  httpOptions: {
    agent: agent
  }
})
```

The preceding code globally sets the ‘connection: keep-alive’ flag for all clients.

In our log parser, setting keepalive to true didn’t introduce a significant performance improvement. We only improved by about 50ms because we were already batching our calls, and in this specific function we didn’t make many calls using the aws-sdk resources. However, in many other cases we managed to remove hundreds of milliseconds from our function duration.

Initialize Connections Outside of the Handler

This tip is already familiar to most engineers: don’t initialize a client or connection from inside your handler function. Instead, initialize the client or connection from outside your handler function.

Let’s examine the following scenario:

import boto3

def handler(event, context):
    ddb_client = boto3.client('dynamodb')
    # PostgreSQL connection...
    # Other connections and initializations...
    # Per event logic…

In the preceding code, if the connection to our database takes 20ms, it means that every invocation incurs an extra duration that is not really necessary. Instead, we take all connections out of the handler function so it will take place only once, when a new function instance spawns:

import boto3
ddb_client = boto3.client('dynamodb')
# PostgreSQL connection...
# Other connections and initializations…

def handler(event, context):
    # Per event logic...

This change improves performance further, especially on high concurrent Lambda functions. We saved another 30ms on average.

Tuning Memory Configuration

It became clear to us the function’s memory also affects the CPU and network performance. Choosing the right amount of memory can result in a faster function, and in some cases, lower cost.

The memory calculation can be tricky, but we’ll use a simple example to get across the basic idea.

If a function is running at 1000ms on average, and we define it with 128MBs, the price per invocation would be ~$0.000002. If doubling the memory would also double the performance, if the function had 256MB memory, it would run at 500ms on average. This means the price per invocation would be ~$0.000002. The same price, but twice as fast.

Let’s compare a few more scenarios:

Memory Average Duration Price
128MB 1000ms ~$0.000002
256MB 500ms ~$0.000002
512MB 250ms ~$0.0000024

Note that 512MB of memory increases the cost because the pricing of an invocation is rounded up to the nearest 100ms; hence, we’re paying for 300ms.

The hardest part is to understand which memory size works best for each Lambda function. Luckily, with the open source lambda-memory-performance-benchmark, we were able to measure the best performance configuration:=.

Epsagon-Lambda-Costs-4

Figure 4 – Caption goes here.

Our 512MB configuration resulted in ~950ms on average, whereas a 1536MB configuration resulted in ~304ms. To take our analysis even further, we selected 1644MB of memory, and it resulted in less than 300ms.

The main reason to go with 1644MB is the 100ms interval pricing. On such a high scale, this 15ms difference between 290ms and 305ms has a significant impact on cost.

Conclusion

Our optimization process helped us realize that with proper visibility into our stack, we were able to clearly identify what and how to optimize. We not only improved the performance of the main AWS Lambda function in our pipeline, but also reduced the cost of the others services: Amazon Kinesis Data Streams, Amazon DynamoDB, and Amazon RDS tables:

Resource Before After Why
AWS Lambda $1,850 $350

Fewer invocations

Faster average duration

Amazon DynamoDB $800 $500 Fewer calls (less Read Capacity Units)
Amazon Kinesis Data Stream $270 $120 Fewer shards since invocations run faster
Amazon RDS $510 $260 Fewer concurrent calls (reduced IOPS, a smaller instance could be used)

Overall, we managed to improve the performance by x4 (~1400ms to ~300ms) for an improved customer experience, while also reducing the overall cost of this service by 65 percent ($3,430 to $1,230 monthly).

It’s important to understand that when the scale is large, each small improvement in performance can dramatically impact the overall cost of services.

To get started measuring the performance and costs of your functions, use:

.
Epsagon-APN-Blog-CTA-2
.


Epsagon – APN Partner Spotlight

Epsagon is an AWS Competency Partner specializing in automated tracing for cloud microservices. Its solution builds on AWS tools by providing automated end-to-end tracing across distributed AWS services, and services outside of AWS.

Contact Epsagon | Solution Overview | AWS Marketplace

*Already worked with Epsagon? Rate this Partner

*To review an APN Partner, you must be an AWS customer that has worked with them directly on a project.

Summer school: Statistical Methods for Linguistics and Psychology, 2020

$
0
0

Feed: R-bloggers.
Author: Shravan Vasishth.

[This article was first published on Shravan Vasishth’s Slog (Statistics blog), and kindly contributed to R-bloggers]. (You can report issue about the content on this page here)

Want to share your content on R-bloggers? click here if you have a blog, or here if you don’t.

 The summer school website has been updated with the materials (lecture notes, exercises, and videos) for the Introductory frequentist and Bayesian streams. Details here:

https://vasishth.github.io/smlp2020/ 

To leave a comment for the author, please follow the link and comment on their blog: Shravan Vasishth’s Slog (Statistics blog).

R-bloggers.com offers daily e-mail updates about R news and tutorials about learning R and many other topics. Click here if you’re looking to post or find an R/data-science job.


Want to share your content on R-bloggers? click here if you have a blog, or here if you don’t.

Redis Labs raises $100M, enters the unicorn club

$
0
0

Feed: Redis.
Author: Steve Naventi.

California-based software company Redis Labs (earlier known as Garantia Data) announced on Tuesday that it has closed its Series F round of funding, raising $100 million. The investment round was co-led by Bain Capital Ventures and TCV. Existing investors Francisco Partners, Goldman Sachs Growth, Viola Ventures and Dell Technologies Capital also participated in the round.

Redis Labs

(L-R) Yuftach Shoolman and Ofer Bengal, Founders of Redis Labs


Redis Labs is the company behind Redis, an open source database and provider of Redis Enterprise. With this fresh round of investments, Redis Labs has now entered the unicorn club (companies with more than $1 billion valuation). The company has so far raised $246 million.

Enrique Salem, Partner at Bain Capital Ventures said:

“We’ve long believed in the market opportunity for a high-performance database in the cloud-era and Redis’ potential to lead this category. Since our initial Series A investment, the Redis team has done a remarkable job making Redis an essential tool for developers and being a trusted partner for global enterprises operating at scale.”

Founded in 2011 by Ofer Bengal and Yiftach Shoolman, Redis Labs is based out of Mountain View, California, with its global research and development centre in Tel Aviv. Additionally, Redis Labs has its offices in India (Bengaluru), London, and Austin, Texas.

In an interaction with YourStory, Ofer Bengal, Co-founder and CEO at Redis Labs, said the company will now prioritise investing in open source Redis from a technology and community standpoint. Additionally, it will widen the competitive edge of Redis Enterprise by adding and expanding the use cases for developers. With the fresh funds, Redis Labs plans to continue growing its sales and marketing teams.

Funding

Image Source: Shutterstock

Ofer added, “The unprecedented conditions brought on by COVID-19 have accelerated business investments in building applications that require real-time, intelligent data processing in the cloud. During this time, Redis has become even more critical to our customers, partners, and community. We will continue to invest in strengthening our community footprint, advancing the Redis technology, and helping our users to do more with Redis.”

It provides real-time database and data platform that enables companies to manage, process, analyse and make predictions with their data. Currently Redis Labs serves more than 7,500 customers. Some of its marquee clients include MasterCard, Dell, Fiserv, Home Depot, Microsoft, Costco, Gap and Groupon. In India, Redis Labs works with companies include Freshworks, Hike, Matrimony.com, Razorpay and Swiggy, among others.

Earlier in May this year, Redis Labs signed a strategic alliance agreement with Microsoft Azure for making Redis Enterprise the top tier of Azure Cache for Redis, and launched it in Private Preview, which is expected in early fall. Ofer told YourStory that the company’s immediate goal is to deliver the Redis Enterprise tiers on Azure Cache for Redis.

Additionally, Redis Labs wants to expand the usage of Redis beyond caching. “We will do this by supporting modern data models like JSON, Streams, time-series, graph and RedisAI,” Ofer added.

Since the launch of Redis Enterprise Cloud as a native service on Google Cloud, in October 2019, the service has experienced over 300 percent growth in just two quarters. Redis Labs has also been identified as an advanced technology partner with Amazon Web Services Partner Network.

Want to make your startup journey smooth? YS Education brings a comprehensive Funding Course, where you also get a chance to pitch your business plan to top investors. Click here to know more.

Introducing the Redis Data Source Plug-in for Grafana

$
0
0

Feed: Redis.
Author: Alexey Smolyanyy.

Grafana is a well-known and widely used open source application monitoring tool. And now, thanks to the new Redis Data Source for Grafana plug-in, it works with Redis!  

With this new capability, DevOps practitioners and database admins can use a tool they are already familiar with to easily create dashboards to monitor their Redis databases and application data. The new Grafana Redis Data Source plug-in allows you to visualize RedisTimeSeries data and core Redis data types like Strings, Hashes, Sets, and more. Also, it can parse and display the output of Redis admin commands, such as SLOWLOG GET, INFO, and CLIENT LIST.

Redis Data Source for Grafana’s monitoring dashboard. Grafana is a popular open-source monitoring tool used to build interactive dashboards for tracking application and infrastructure performance.

Getting started with the Redis Data Source for Grafana

The new Redis Data Source for Grafana can connect to any Redis database—including open source Redis, Redis Enterprise, Redis Enterprise Cloud—and works with Grafana 7.0 and later. If you already have Grafana 7.0, you can install the Data Source plug-in with this grafana-cli command:

grafana-cli plugins install redis-datasource

If you don’t have Grafana installed, or just want to try the new data source, you can easily get started with Grafana in a Docker container:

docker run -d -p 3000:3000 --name=grafana -e "GF_INSTALL_PLUGINS=redis-datasource" grafana/grafana

Setting up Redis Data Source for Grafana is just as easy as working with any other Grafana data source. There are additional configuration options available, besides the server address and port, including database password and Transport Layer Security (TLS) connection. 

Redis Data Source for Grafana configuration options.

After you complete the initial configuration, you can start to create panels displaying Redis data! The Redis Data Source plug-in supports three different command types: Redis commands, RedisTimeSeries commands, and universal inputs.

The Redis Data Source for Grafana has a drop-down list to choose command type.

1. Redis commands comprise a number of predefined commands to retrieve core Redis data types, such as Hashes, Sets, Strings, Streams, etc. The command’s output is pre-formatted for easy use in the Grafana interface. This mode also allows you to execute Redis admin commands: SLOWLOG GET, INFO, CLIENT LIST. Their output comes in newly introduced data frames, so you can apply Grafana transformations to modify the standard output.  

Configuring the Grafana dashboard for the INFO MEMORY command.

2. RedisTimeSeries commands offer an interface to let you work with the RedisTimeSeries module. Currently, it supports two commands: TS.RANGE and TS.MRANGE, which let you query a range from one or more time series. The example below shows the number of downloads of the Redis Data Source from the Grafana repository.

The graph represents the number of downloads of the Redis Data Source from the Grafana repository.

3. Universal input allows you to use other commands, not supported by the first two modes. Please keep in mind that:

  • Universal input does not support all Redis commands.
  • The output of these commands is not preformatted for Grafana, so some Grafana features may not work correctly.

Real-time monitoring with the INFO command

To get started, install the Redis Monitoring Dashboard, built for the new Grafana Data Source, and play with it.

The monitoring dashboard uses various sections of the INFO command with the relevant Grafana transformation. Additionally, it has a SLOWLOG panel, so you can quickly identify your slowest queries (which can impact the performance of your Redis database), and a CLIENT LIST panel displaying the information about client connections.

This sample panel shows SLOWLOG GET command output.

There are endless possibilities to use the new Redis Data Source Plug-in for Grafana; we plan to share more example dashboards, including a fun application for weather geeks, in the coming weeks. So please stay tuned!

Viewing all 965 articles
Browse latest View live