Quantcast
Channel: Streams – Cloud Data Architect
Viewing all 965 articles
Browse latest View live

Building storage-first serverless applications with HTTP APIs service integrations

$
0
0

Feed: AWS Compute Blog.
Author: Eric Johnson.

Over the last year, I have been talking about “storage first” serverless patterns. With these patterns, data is stored persistently before any business logic is applied. The advantage of this pattern is increased application resiliency. By persisting the data before processing, the original data is still available, if or when errors occur.

Common pattern for serverless API backend

Common pattern for serverless API backend

Using Amazon API Gateway as a proxy to an AWS Lambda function is a common pattern in serverless applications. The Lambda function handles the business logic and communicates with other AWS or third-party services to route, modify, or store the processed data. One option is to place the data in an Amazon Simple Queue Service (SQS) queue for processing downstream. In this pattern, the developer is responsible for handling errors and retry logic within the Lambda function code.

The storage first pattern flips this around. It uses native error handling with retry logic or dead-letter queues (DLQ) at the SQS layer before any code is run. By directly integrating API Gateway to SQS, developers can increase application reliability while reducing lines of code.

Storage first pattern for serverless API backend

Storage first pattern for serverless API backend

Previously, direct integrations require REST APIs with transformation templates written in Velocity Template Language (VTL). However, developers tell us they would like to integrate directly with services in a simpler way without using VTL. As a result, HTTP APIs now offers the ability to directly integrate with five AWS services without needing a transformation template or code layer.

The first five service integrations

This release of HTTP APIs direct integrations includes Amazon EventBridge, Amazon Kinesis Data Streams, Simple Queue Service (SQS), AWS System Manager’s AppConfig, and AWS Step Functions. With these new integrations, customers can create APIs and webhooks for their business logic hosted in these AWS services. They can also take advantage of HTTP APIs features like authorizers, throttling, and enhanced observability for securing and monitoring these applications.

Amazon EventBridge

HTTP APIs service integration with Amazon EventBridge

HTTP APIs service integration with Amazon EventBridge

The HTTP APIs direct integration for EventBridge uses the PutEvents API to enable client applications to place events on an EventBridge bus. Once the events are on the bus, EventBridge routes the event to specific targets based upon EventBridge filtering rules.

This integration is a storage first pattern because data is written to the bus before any routing or logic is applied. If the downstream target service has issues, then EventBridge implements a retry strategy with incremental back-off for up to 24 hours. Additionally, the integration helps developers reduce code by filtering events at the bus. It routes to downstream targets without the need for a Lambda function as a transport layer.

Use this direct integration when:

  • Different tasks are required based upon incoming event details
  • Only data ingestion is required
  • Payload size is less than 256 kb
  • Expected requests per second are less than the Region quotas.

Amazon Kinesis Data Streams

HTTP APIs service integration with Amazon Kinesis Data Streams

HTTP APIs service integration with Amazon Kinesis Data Streams

The HTTP APIs direct integration for Kinesis Data Streams offers the PutRecord integration action, enabling client applications to place events on a Kinesis data stream. Kinesis Data Streams are designed to handle up to 1,000 writes per second per shard, with payloads up to 1 mb in size. Developers can increase throughput by increasing the number of shards in the data stream. You can route the incoming data to targets like an Amazon S3 bucket as part of a data lake or a Kinesis data analytics application for real-time analytics.

This integration is a storage first option because data is stored on the stream for up to seven days until it is processed and routed elsewhere. When processing stream events with a Lambda function, errors are handled at the Lambda layer through a configurable error handling strategy.

Use this direct integration when:

  • Ingesting large amounts of data
  • Ingesting large payload sizes
  • Order is important
  • Routing the same data to multiple targets

Amazon SQS

HTTP APIs service integration with Amazon SQS

HTTP APIs service integration with Amazon SQS

The HTTP APIs direct integration for Amazon SQS offers the SendMessage, ReceiveMessage, DeleteMessage, and PurgeQueue integration actions. This integration differs from the EventBridge and Kinesis integrations in that data flows both ways. Events can be created, read, and deleted from the SQS queue via REST calls through the HTTP API endpoint. Additionally, a full purge of the queue can be managed using the PurgeQueue action.

This pattern is a storage first pattern because the data remains on the queue for four days by default (configurable to 14 days), unless it is processed and removed. When the Lambda service polls the queue, the messages that are returned are hidden in the queue for a set amount of time. Once the calling service has processed these messages, it uses the DeleteMessage API to remove the messages permanently.

When triggering a Lambda function with an SQS queue, the Lambda service manages this process internally. However, HTTP APIs direct integration with SQS enables developers to move this process to client applications without the need for a Lambda function as a transport layer.

Use this direct integration when:

  • Data must be received as well as sent to the service
  • Downstream services need reduced concurrency
  • The queue requires custom management
  • Order is important (FIFO queues)

AWS AppConfig

HTTP APIs service integration with AWS Systems Manager AppConfig

HTTP APIs service integration with AWS Systems Manager AppConfig

The HTTP APIs direct integration for AWS AppConfig offers the GetConfiguration integration action and allows applications to check for application configuration updates. By exposing the systems parameter API through an HTTP APIs endpoint, developers can automate configuration changes for their applications. While this integration is not considered a storage first integration, it does enable direct communication from external services to AppConfig without the need for a Lambda function as a transport layer.

Use this direct integration when:

  • Access to AWS AppConfig is required.
  • Managing application configurations.

AWS Step Functions

HTTP APIs service integration with AWS Step Functions

HTTP APIs service integration with AWS Step Functions

The HTTP APIs direct integration for Step Functions offers the StartExecution and StopExecution integration actions. These actions allow for programmatic control of a Step Functions state machine via an API. When starting a Step Functions workflow, JSON data is passed in the request and mapped to the state machine. Error messages are also mapped to the state machine when stopping the execution.

This pattern provides a storage first integration because Step Functions maintains a persistent state during the life of the orchestrated workflow. Step Functions also supports service integrations that allow the workflows to send and receive data without needing a Lambda function as a transport layer.

Use this direct integration when:

  • Orchestrating multiple actions.
  • Order of action is required.

Building HTTP APIs direct integrations

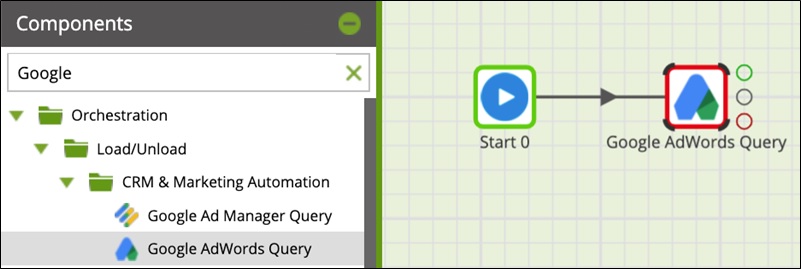
HTTP APIs service integrations can be built using the AWS CLI, AWS SAM, or through the API Gateway console. The console walks through contextual choices to help you understand what is required for each integration. Each of the integrations also includes an Advanced section to provide additional information for the integration.

Creating an HTTP APIs service integration

Creating an HTTP APIs service integration

Once you build an integration, you can export it as an OpenAPI template that can be used with infrastructure as code (IaC) tools like AWS SAM. The exported template can also include the API Gateway extensions that define the specific integration information.

Exporting the HTTP APIs configuration to OpenAPI

Exporting the HTTP APIs configuration to OpenAPI

OpenAPI template

An example of a direct integration from HTTP APIs to SQS is located in the Sessions With SAM repository. This example includes the following architecture:

AWS SAM template resource architecture

AWS SAM template resource architecture

The AWS SAM template creates the HTTP APIs, SQS queue, Lambda function, and both Identity and Access Management (IAM) roles required. This is all generated in 58 lines of code and looks like this:

AWSTemplateFormatVersion: '2010-09-09'
Transform: AWS::Serverless-2016-10-31
Description: HTTP API direct integrations

Resources:
  MyQueue:
    Type: AWS::SQS::Queue
    
  MyHttpApi:
    Type: AWS::Serverless::HttpApi
    Properties:
      DefinitionBody:
        'Fn::Transform':
          Name: 'AWS::Include'
          Parameters:
            Location: './api.yaml'
          
  MyHttpApiRole:
    Type: "AWS::IAM::Role"
    Properties:
      AssumeRolePolicyDocument:
        Version: "2012-10-17"
        Statement:
          - Effect: "Allow"
            Principal:
              Service: "apigateway.amazonaws.com"
            Action: 
              - "sts:AssumeRole"
      Policies:
        - PolicyName: ApiDirectWriteToSQS
          PolicyDocument:
            Version: '2012-10-17'
            Statement:
              Action:
              - sqs:SendMessage
              Effect: Allow
              Resource:
                - !GetAtt MyQueue.Arn
                
  MyTriggeredLambda:
    Type: AWS::Serverless::Function
    Properties:
      CodeUri: src/
      Handler: app.lambdaHandler
      Runtime: nodejs12.x
      Policies:
        - SQSPollerPolicy:
            QueueName: !GetAtt MyQueue.QueueName
      Events:
        SQSTrigger:
          Type: SQS
          Properties:
            Queue: !GetAtt MyQueue.Arn

Outputs:
  ApiEndpoint:
    Description: "HTTP API endpoint URL"
    Value: !Sub "https://${MyHttpApi}.execute-api.${AWS::Region}.amazonaws.com"

The OpenAPI template handles the route definitions for the HTTP API configuration and configures the service integration. The template looks like this:

openapi: "3.0.1"
info:
  title: "my-sqs-api"
paths:
  /:
    post:
      responses:
        default:
          description: "Default response for POST /"
      x-amazon-apigateway-integration:
        integrationSubtype: "SQS-SendMessage"
        credentials:
          Fn::GetAtt: [MyHttpApiRole, Arn]
        requestParameters:
          MessageBody: "$request.body.MessageBody"
          QueueUrl:
            Ref: MyQueue
        payloadFormatVersion: "1.0"
        type: "aws_proxy”
        connectionType: "INTERNET"
x-amazon-apigateway-importexport-version: "1.0"

Because the OpenAPI template is included in the AWS SAM template via a transform, the API Gateway integration can reference the roles and services created within the AWS SAM template.

Conclusion

This post covers the concept of storage first integration patterns and how the new HTTP APIs direct integrations can help. I cover the five current integrations and possible use cases for each. Additionally, I demonstrate how to use AWS SAM to build and manage the integrated applications using infrastructure as code.

Using the storage first pattern with direct integrations can help developers build serverless applications that are more durable with fewer lines of code. A Lambda function is no longer required to transport data from the API endpoint to the desired service. Instead, use Lambda function invocations for differentiating business logic.

To learn more join us for the HTTP API service integrations session of Sessions With SAM! 

#ServerlessForEveryone


Rewinding random number streams: An application

$
0
0

Feed: SAS Blogs.
Author: Rick Wicklin.


In the paper “Tips and Techniques for Using the Random-Number Generators in SAS” (Sarle and Wicklin, 2018), I discussed an example that uses the new STREAMREWIND subroutine in Base SAS 9.4M5.
As its name implies, the STREAMREWIND subroutine rewinds a random number stream, essentially resetting the stream to the beginning. I struggled to create a compelling example for the STREAMREWIND routine because using the subroutine
“results in dependent streams of numbers” and because “it is usually not necessary in simulation studies” (p. 12).
Regarding an application, I asserted that the subroutine “is convenient for testing.”


But recently I was thinking about two-factor authentication and realized that I could use the STREAMREWIND subroutine to emulate generating a random token that changes every 30 seconds. I think it is a cool example, and it gives me the opportunity to revisit some of the newer features of random-number generation in SAS, including new generators and random number keys.


A brief overview of two-factor authentication


I am not an expert on two-factor authentication (TFA), but I use it to access my work computer, my bank accounts, and other sensitive accounts.
The main idea behind TFA is that before you can access a secure account, you must authenticate yourself in two ways:

  • Provide a valid username and password.
  • Provide information that depends on a physical device that you own and that you have previously registered.


Most people use a smartphone as the physical device, but it can also be a PC or laptop. If you do an internet search for “two factor authentication tokens,” you can find many images like the one on the right. This is the display from a software program that runs on a PC, laptop, or phone. The “Credential ID” field is a long string that is unique to each device. (For simplicity, I’ve replaced the long string with “12345.”)
The “Security Code” field displays a pseudorandom number that changes every 30 seconds.
The Security Code depends on the device and on the time of day (within a 30-second interval). In the image, you can see a small clock and the number 28, which indicates that the Security Code will be valid for another 28 seconds before a new number is generated.


After you provide a valid username and password, the account challenges you to type in the current Security Code for your registered device.
When you submit the Security Code, the remote server checks whether the code is valid for your device and for the current time of day. If so, you can access your account.


Two-factor random number streams


I love the fact that the Security Code is pseudorandom and yet verifiable. And it occurred to me that I can use the main idea of TFA to demonstrate some of the newer features in the SAS random number generators (RNGs).


Long-time SAS programmers know that each stream is determined by a random number seed. But a newer feature is that you can also set a “key” for a random number stream. For several of the new RNGs, streams that have the same seed but different keys are independent. You can use this fact to emulate the TFA app:

  • The Credential ID (which is unique to each device) is the “seed” for an RNG.
  • The time of day is the “key” for an RNG. Because the Security Code must be valid for 30 seconds, round the time to the nearest 30-second boundary.
  • Usually each call to the RAND function advances the state of the RNG so that the next call to RAND produces a new pseudorandom number. For this application, we want to get the same number for any call within a 30-second period. One way to do this is to reset the random number stream before each call so that RAND always returns the FIRST number in the stream for the (seed, time) combination.

Using a key to change a random-number stream


Before worrying about using the time of day as the key value, let’s look at a simpler program
that returns the first pseudorandom number from independent streams that have the same seed but different key values.
I will use PROC FCMP to write a function that can be called from the SAS DATA step.
Within the DATA step, I set the seed value and use the “Threefry 2” (TF2) RNG. I then call the Rnd6Int
function for six different key values.

proc fcmp outlib=work.TFAFunc.Access;
   /* this function sets the key of a random-numbers stream and 
      returns the first 6-digit pseudorandom number in that stream */
   function Rnd6Int(Key);
      call stream(Key);               /* set the Key for the stream */
      call streamrewind(Key);         /* rewind stream with this Key */
      x = rand("Integer", 0, 999999); /* first 6-digit random number in stream */
      return( x );
   endsub;
quit;
 
options cmplib=(work.TFAFunc);       /* DATA step looks here for unresolved functions */
data Test;
DeviceID = 12345;                    /* ID for some device */
call streaminit('TF2', DeviceID);    /* set RNG and seed (once per data step) */
do Key = 1 to 6;
   SecCode = Rnd6Int(Key);           /* get random number from seed and key values */
   /* Call the function again. Should produce the same value b/c of STREAMREWIND */
   SecCodeDup = Rnd6Int(Key);  
   output;
end;
keep DeviceID Key SecCode:;
format SecCode SecCodeDup Z6.;
run;
 
proc print data=Test noobs; run;


Each key generates a different pseudorandom six-digit integer.
Notice that the program calls the Rnd6Int function twice for each seed value.
The function returns the same number each time because the random number stream for the (seed, key) combination gets reset by the STREAMREWIND call during each call.
Without the STREAMREWIND call, the function would return a different value for each call.


Using a time value as a key


With a slight modification, the program in the previous section can be made to emulate the program/app that generates a new TFA token every 30 seconds. However, so that we don’t have to wait so long, the following program sets the time interval (the DT macro) to 10 seconds instead of 30. Instead of talking about a 30-second interval or a 10-second interval, I will use the term “DT-second interval,” where DT can be any time interval.


The program below gets the “key” by looking at the current datetime value and rounding it to the nearest DT-second interval. This value (the RefTime variable) is sent to the Rnd6Int function to generate a pseudorandom Security Code. To demonstrate that the program generates a new Security Code every DT seconds, I call the Rnd6Int function 10 times, waiting 3 seconds between each call. The results are printed below:

%let DT = 10;                  /* change the Security Code every DT seconds */
 
/* The following DATA step takes 30 seconds to run because it
   performs 10 iterations and waits 3 secs between iterations */
data TFA_Device;
keep DeviceID Time SecCode;
DeviceID = 12345;
call streaminit('TF2', DeviceID);   /* set the RNG and seed */
do i = 1 to 10;
   t = datetime();                  /* get the current time */
   /* round to the nearest DT seconds and save the "reference time" */
   RefTime = round(t, &DT); 
   SecCode = Rnd6Int(RefTime);      /* get a random Security Code */
   Time = timepart(t);              /* output only the time */
   call sleep(3, 1);                /* delay 3 seconds; unit=1 sec */
   output;
end;
format Time TIME10. SecCode Z6.;
run;
 
proc print data=TFA_Device noobs; 
   var DeviceId Time SecCode;
run;


The output shows that the program generated three different Security Codes. Each code is constant for a DT-second period (here, DT=10) and then changes to a new value. For example, when the seconds are in the interval [05, 15), the Security Code has the same value. The Security Code is also constant when the seconds are in the interval [15, 25) and so forth.
A program like this emulates the behavior of an app that generates a new pseudorandom Security Code every DT seconds.


Different seeds for different devices


For TFA, every device has a unique Device ID. Because the Device ID is used to set the random number seed, the pseudorandom numbers that are generated on one device will be different than the numbers generated on another device. The following program uses the Device ID as the seed value for the RNG and the time of day for the key value. I wrapped a macro around the program and called it for three hypothetical values of the Device ID.

%macro GenerateCode(ID, DT);
data GenCode;
   keep DeviceID Time SecCode;
   format DeviceID 10. Time TIME10. SecCode Z6.;
   DeviceID = &ID;
   call streaminit('TF2', DeviceID); /* set the seed from the device */
   t = datetime();                   /* look at the current time */
   /* round to the nearest DT seconds and save the "reference time" */
   RefTime = round(t, &DT);          /* round to nearest DT seconds */
   SecCode = Rnd6Int(RefTime);       /* get a random Security Code */
   Time = timepart(t);               /* output only the time */
run;
 
proc print data=GenCode noobs; run;
%mend;
 
/* each device has a unique ID */
%GenerateCode(12345, 30);
%GenerateCode(24680, 30);
%GenerateCode(97531, 30);


As expected, the program produces different Security Codes for different Device IDs, even though the time (key) value is the same.


Summary


In summary, you can use features of the SAS random number generators in SAS 9.4M5 to emulate the behavior of a TFA token generator. The SAS program in this article uses the Device ID as the “seed” and the time of day as a “key” to select an independent stream. (Round the time into a certain time interval.) For this application, you don’t want the RAND function to advance the state of the RNG, so you can use the STREAMREWIND call to rewind the stream before each call. In this way, you can generate a pseudorandom Security Code that depends on the device and is valid for a certain length of time.


What to do when your Data Warehouse Chokes on Big Data

$
0
0

Feed: Actian.
Author: Pradeep Bhanot.

This may seem like an academic question, but it is increasingly becoming a reality for modern businesses. What do you do when you have millions of records with infinite width and depth, and your data warehouse chokes?  Do you trim your data?  Do you add more infrastructure capacity?  Or do you need to look at a better data warehouse solution?

This problem is akin to owning an old car that makes a bunch of noises, smells terrible, and has wheels that rattle when you drive down the road.  What do you do about it?  Drive slower (that’s annoying), open the windows for some fresh air, and turn up the radio to drown out the sounds?  Do you get some new tires, an air freshener, and a louder radio to mask the issues?  Or do you consider buying a new car?  Nostalgia may be a valid reason to keep a classic car, but it isn’t a good reason to keep a data warehouse around that isn’t meeting your business needs. Your business is evolving, and you need a data warehouse platform that will give you agility and the ability to move faster, not slow you down.

Where is the Infinite Data Problem Coming From?

The digital transformation of business processes and the rapid adoption of modern connected technology is what is driving the infinite data challenge.  Instead of having a business run on a few core platforms with well-structured data schemas and transactional data growth curves that are relatively flat, modern businesses are embracing a wide variety of specialized systems and things like IoT and mobile devices that produce seemingly endless streams of data.  This “measure everything” culture, combined with an uptick in data update volume from transactional systems, leads to a data profile where there can be an infinite number of rows of data and a seemingly infinite set of column attributes that are collected.  This problem is a sign of success – it means that your organization understands the value of data and is actively working to collect the most diverse and expansive information footprint they can.  You don’t want your data warehouse system to get in the way of that.

Why is Your Data Warehouse Choking on Big Data?

Most data warehouses were designed for on-prem infrastructure hardware with fixed capacity and processing optimized for relational database schemas.  This is what companies needed five years ago.  Times have changed.  Traditional data warehouses are choking because they aren’t architected for big-data analytics in real-time.  They aren’t deployed on flexible and scalable cloud infrastructures and configured for on-demand resource scaling, and they are trying to apply old-school scalar processing approaches to modern data structures.  If you give the system enough time, it will get the job done, just not with the speed that most modern businesses demand.

A Modern Solution to The Big Data Problem

Actian Avalanche is a modern solution to your big data problem.  Designed for high-efficiency processing, deployed on scalable cloud infrastructure, and leveraging high-performance vectorized data processing, Avalanche can meet the big data challenges of today and give you plenty of growth room for the future.  Yes, many other data warehouse solutions can be deployed in the cloud to give you access to the compute and storage capacity, but in a side by side comparison, Actian’s unique approach out-performs the next best option and through highly efficient hardware utilization that can deliver higher performance at a much lower cloud cost.  To learn more about how Actian Avalanche delivers superior performance and can cut your cloud data warehouse bill in half, check out this video.

To learn more about how Actian Avalanche can help you address your business’s big data problems, visit www.actian.com/avalanche.

Will a Few Milliseconds Ruin Your Analytics Performance in the Cloud?

$
0
0

Feed: Teradata Blog.

Have you ever thought about what can be done in a millisecond (ms)? A housefly can flap its wing in 3ms while a honeybee takes 5ms. A human however takes 300ms to blink their eye. Milliseconds are only 1/1000 of a second so they seem so insignificant. But it doesn’t take many of them to wreak havoc on cloud communication performance.

In an earlier blog post I talked about the need to consider geography when developing your cloud architecture. Primarily that was because of network latency and its negative performance effect on the cloud Wide Area Network (WAN). In that article I jumped to the solution for the latency issues without explaining why. I think it’s insightful to know why because If you can master the why then you’ll be on your way to becoming a WAN performance expert.

I’ve been helping Teradata customers migrate their Vantage systems to the cloud for over three years and WAN performance is always a major concern. I have an electrical engineering degree and designed WAN network gear in the 1980s, but I always felt uncomfortable trying to diagnose cloud WAN performance issues. My standard response was to run to our resident network guru for help. Admittedly my network skills were rusty, but no amount of Internet research provided the whole picture I needed. It was only after a year of conversations with our network guru did I finally catch the simplicity of the issue that seemed so elusive. My goal here is to take that insight and present a simple explanation that will make you the master of cloud WAN communications.

The explanation starts with an application’s need for reliable data transmission. Reliable transmission is achieved with network protocols that use data packet acknowledgements (Ack) as shown in Figure 1. The sender sends a data packet and then waits for the receiver’s Ack indicating the transmission was successful. The sender is idle for the total round-trip time while it waits for the receiver’s Ack. It is this idle time that kills network performance for single data streams if you have large network latency as most WANs do.


Figure 1 Reliable Data Transmission via Data Packet Acknowledgements
The key to understanding WAN performance is knowing there are two sets of Acks for application data transfers; the network layer and the application layer. The network layer is mostly TCP/IP, which of course is the protocol that runs the Internet. Internet research on WAN optimization almost exclusively talks about the network layer and TCP/IP. These sites are useful as they inform on how TCP/IP has windowing techniques that, though imperfect, will neutralize the WAN latency issue. It is because of this windowing function that we can assume the network layer is optimized and ignore these Acks for this discussion.

The second set of Acks occur at the application layer. Here we’re talking about protocols like ODBC, JDBC or the native database protocols that run over TCP/IP. My Internet research failed to turn up much information on these Acks or their effect on WAN communications. As it turns out these protocols do not have windowing techniques and therefore are very susceptible to WAN latency issues.

Let’s look at some examples with diagrams that for me finally brought the WAN performance picture in to focus. For Local Area Networks (LAN) the latency is usually less than 1 ms. Therefore, the wait time for data Acks is minor compared to the time it takes to send the data so there is little idle time on the network (Figure 2). Thus, for single data streams the LAN throughput is close to the network bandwidth.

Picture1-(1).png
Figure 2: Large File Transfer with 1ms Latency     
   
Picture1-(2).png
Figure 3: Large File Transfer with 35ms Latency
But what happens when the latency increases to 35 ms, which is a modest WAN latency? Figure 3 shows the idle time has increased significantly and therefore the network throughput has plummeted for this single data stream. Many people think that increasing the bandwidth can counter act this issue, but that is not true. More bandwidth cannot counteract latency issues. The main way to fill idle time on the WAN is to run additional parallel data streams. It is easy to see that multiple streams like the one in Figure 3 would fill the idle time.

So even if your cloud WAN latency is quicker than the blink of an eye, you have the potential for performance issues. Therefore, it is critical when moving large amounts of data over the WAN to use applications that support parallel data streams. Vantage, which was “Born to be Parallel,” supports several methods of moving data using parallel data streams which makes Vantage ideal for cloud computing.

(Author):


W. Scott Wearn

Scott has 30+ years of experience in the information technology field, with 25+ years at Teradata. Scott has held many positions at Teradata including Professional Services Partner, Architectural Consultant, Data Warehouse consultant, Solution Architect (supporting Teradata clients) and is currently an Ecosystem Architect. Scott recently ran a Cloud Architecture Practice which helped customers migrate their Teradata solutions to the cloud.
 

View all posts by W. Scott Wearn

Reshaping Healthcare with Data Analytics & Business Intelligence

$
0
0

Feed: Featured Blog Posts – Data Science Central.
Author: Tanya Kumari.

Big data analytics in the healthcare industry today is evolving into a promising field for delivering real-time insights from very large data sets. Plus, it also helps improve outcomes while reducing costs.

The trending digitization is leveraging the potential of data analytics and business intelligence.

According to Industry experts, the AI health market is to reach $6.6 billion by 2021, and by 2026 can potentially save the U.S. healthcare economy $150 billion in annual savings.

Today, the changing landscape of healthcare is creating a huge demand for health data analytics. Modern and cutting-edge data analytics are used to improves patient care in the healthcare system. Analyzing the available data with the best modern practices helps cut costs and also improves the health of the people in a faster way.

Data Analytics- A Brief Intro

Data Analytics is a process of collecting, inspecting, transforming, and analyzing data to generate real-time insights that can help in making crucial decisions faster.

In Gartner terms, ”Big Data is defined as volume, high-velocity and high-variety information assets that require cost-effective, innovative forms of information processing for enhanced insight and decision making”.

Advantages of Data Analytics in Healthcare

Let’s check out some of the key advantages of the Big Data Analytics in Healthcare industry:

Monitoring

The monitoring of vital signs is important to ensure a proactive approach to a person’s healthy state. For instance, diabetic patients can track their next insulin dosages, upcoming medical appointments, and so on.

Cost reduction 

Big Data facilitates managing crucial information and uses it to drive cost improvements. With real-insights assistance, health care organizations can track areas where cost can be minimized such as diagnostic tests, admission rates, etc.

Error minimization and precise treatments

Big Data helps healthcare organizations to provide accurate and personalized care treatment. With real-time insights, it is easier to get a fast response to a particular treatment.


Preventive care 

Big data provides preventive care services to enhance the prevention of medical risks and work more efficiently in taking care of the patients.


Streamline hospital operations

 With big data analytics, the data is generated at fast speed and helps in easily managing the operational aspects of the organization. It helps to streamline hospital operations and also tracks staffing metrics.

Big Data role in Healthcare

The potential of Big Data in healthcare relies on the ability to detect patterns and to turn high volumes of data into actionable knowledge for making crucial decisions in a patient’s health. Big data analytics upgrade efficiency in development operations for smart healthcare providers by delivering real-time updates.

The present scenario utilizes real-time dashboards to facilitate businesses to operate seamlessly. Analytics solutions not just only focus on improving a patient’s life but also help enhance stakeholder value, and boost revenues. It helps healthcare organizations with real insights that impact patients’ health.


Healthcare Business Intelligence

Healthcare Business Intelligence is the digital process through which bulk data from the healthcare industry can be collected, refined, and analyzed into real-time insights. The 4 key healthcare areas where business intelligence can be used are- costs, pharmaceuticals, clinical data, and patient behavior.

The health care organizations used business intelligence to store data in a centralized data warehouse, the security of patient’s data, accurate data analysis, and share digital reports to all departments.

Healthcare providers get real actionable insights to reduce cost, boost sales, and improve patient safety with regulations by integrating Business Intelligence. 

According to a report from the McKinsey Global Institute, applying big data to predict U.S. healthcare needs and enhance efficiency and quality could save between $300 and $450 a billion annually.

Benefits Of Business Intelligence in Healthcare

Business Intelligence is a big spectrum and delivers enormous benefits to the Healthcare industry. Let’s have a look into it.

Financial assistance

Automated database systems and intelligent data alerts facilitate maximum transparency in the finance department. Health organizations should implement analytics solutions to address operational, financial, and patient care related activities.

Evaluating performance

Healthcare business intelligence software can easily track healthcare organization activities and create an analysis based on real-time. Specific actions can be taken after collecting data that can enable reduced costs.

Patient satisfaction

By integrating the right analytics software facilitates administrators to easily handle critical tasks, and also keep track of patients’ updated data. 

Coordinating communication

Healthcare analytics software can be used to access patients’ data, current progress, and review the patient’s medical history at any time and any place. The healthcare staff gets updated information faster with real-time data. The medical cases are enhanced and improved by rapidly addressing crucial patient data.

Managing reputation

The healthcare industry today requires agile, fast, interactive software to maximize data values and support decision making. Business Intelligence in healthcare permits organizations to build a reputation around the patient, clinical care, and also drive collaboration through all departments.

Predicting the future

Advanced analytics helps healthcare professionals to have the power to predict certain critical conditions about the future. It helps in taking proactive steps by providing the best care for the patients, and also delivers high-quality treatment.

According to a report, the overall market share of business intelligence in healthcare is to increase by about  17.4% from $3.75 billion in 2017 to $15.88 billion by 2026.

 Key Takeaways

  • The incredible technologies avoid excessive waiting times in healthcare organizations and also improve patient-doctor relationships
  •  It optimizes patient care and revenue streams
  • Take advantage of real-time data for real-life situations
  • Revolutionizing the healthcare industry with the best tools and technologies that affect profits
  • Balancing and recognizing patient-doctors needs with real-time insights
  • It uncovers profound insights and improves operational efficiency


Putting it all Together

The digital era is rapidly changing with the evolving brainstorming technologies every passing day and so as the healthcare industry. The data-driven business intelligence tools and analytics enhances healthcare performance, revenues, and patient experience. Initiating business intelligence in your organization can help you boost your revenues and also improves customer satisfaction.

The upcoming technologies like predictive analytics, Artificial Intelligence, and Machine Learning are revolutionizing healthcare standards and affecting our lives to a great extent.

It’s time for all of us to get digitized and be prepared for miracles going to happen in the coming years.

What Is Data Governance? (And Why Your Organization Needs It)

$
0
0

Feed: erwin Expert Blog – erwin, Inc..
Author: Zak Cole.

Organizations with a solid understanding of data governance (DG) are better equipped to keep pace with the speed of modern business.

In this post, the erwin Experts address:

What Is Data Governance?

It’s often said that when we work together, we can achieve things greater than the sum of our parts. Collective, societal efforts have seen mankind move metaphorical mountains and land on the literal moon.

Such feats were made possible through effective government – or governance.

The same applies to data. A single unit of data in isolation can’t do much, but the sum of an organization’s data can prove invaluable.

Put simply, DG is about maximizing the potential of an organization’s data and minimizing the risk. In today’s data-driven climate, this dynamic is more important than ever.

That’s because data’s value depends on the context in which it exists: too much unstructured or poor-quality data and meaning is lost in a fog; too little insight into data’s lineage, where it is stored, or who has access and the organization becomes an easy target for cybercriminals and/or non-compliance penalties.

So DG is quite simply, about how an organization uses its data. That includes how it creates or collects data, as well as how its data is stored and accessed. It ensures that the right data of the right quality, regardless of where it is stored or what format it is stored in, is available for use – but only by the right people and for the right purpose.

With well governed data, organizations can get more out of their data by making it easier to manage, interpret and use.

Why Is Data Governance Important?

Although governing data is not a new practice, using it as a strategic program is and so are the expectations as to who is responsible for it.

Historically, governing data has been IT’s business because it primarily involved cataloging data to support search and discovery.

But now, governing data is everyone’s business. Both the data “keepers” in IT and the data users everywhere else within the organization have a role to play.

That makes sense, too. The sheer volume and importance of data the average organization now processes are too great to be effectively governed by a siloed IT department.

Think about it. If all the data you access as an employee of your organization had to be vetted by IT first, could you get anything done?

While the exponential increase in the volume and variety of data has provided unparalleled insights for some businesses, only those with the means to deal with the velocity of data have reaped the rewards.

By velocity, we mean the speed at which data can be processed and made useful. More on “The Three Vs of Data” here.

Data giants like Amazon, Netflix and Uber have reshaped whole industries, turning smart, proactive data governance into actionable and profitable insights.

And then, of course, there’s the regulatory side of things. The European Union’s General Data Protection Regulation (GDPR) mandates organization’s govern their data.

Poor data governance doesn’t just lead to breaches – although of course it does – but compliance audits also need an effective data governance initiative in order to pass.

Since non-compliance can be costly, good data governance not only helps organizations make money, it helps them save it too. And organizations are recognizing this fact.

In the lead up to GDPR, studies found that the biggest driver for initiatives for governing data was regulatory compliance. However, since GDPR’s implementation better decision-making and analytics are their top drivers for investing in data governance.

Other areas in where well governed data plays an important role include digital transformation, data standards and uniformity, self-service and customer trust and satisfaction.

For the full list of drivers and deeper insight into the state of data governance, get the free 2020 State of DGA report here.

What Is Good Data Governance?

We’re constantly creating new data whether we’re aware of it or not. Every new sale, every new inquiry, every website interaction, every swipe on social media generates data.

This means the work of governing data is ongoing, and organizations without it can become overwhelmed quickly.

Therefore good data governance is proactive not reactive.

In addition, good data governance requires organizations to encourage a culture that stresses the importance of data with effective policies for its use.

An organization must know who should have access to what, both internally and externally, before any technical solutions can effectively compartmentalize the data.

So good data governance requires both technical solutions and policies to ensure organizations stay in control of their data.

But culture isn’t built on policies alone. An often-overlooked element of good data governance is arguably philosophical. Effectively communicating the benefits of well governed data to employees – like improving the discoverability of data – is just as important as any policy or technology.

And it shouldn’t be difficult. In fact, it should make data-oriented employees’ jobs easier, not harder.

What Are the Key Benefits of Data Governance?

Organizations with a effectively governed data enjoy:

  • Better alignment with data regulations: Get a more holistic understanding of your data and any associated risks, plus improve data privacy and security through better data cataloging.
  • A greater ability to respond to compliance audits: Take the pain out of preparing reports and respond more quickly to audits with better documentation of data lineage.
  • Increased operational efficiency: Identify and eliminate redundancies and streamline operations.
  • Increased revenue: Uncover opportunities to both reduce expenses and discover/access new revenue streams.
  • More accurate analytics and improved decision-making: Be more confident in the quality of your data and the decisions you make based on it.
  • Improved employee data literacy: Consistent data standards help ensure employees are more data literate, and they reduce the risk of semantic misinterpretations of data.
  • Better customer satisfaction/trust and reputation management: Use data to provide a consistent, efficient and personalized customer experience, while avoiding the pitfalls and scandals of breaches and non-compliance.

For a more in-depth assessment of data governance benefits, check out The Top 6 Benefits of Data Governance.

The Best Data Governance Solution

Data has always been important to erwin; we’ve been a trusted data modeling brand for more than 30 years. But we’ve expanded our product portfolio to reflect customer needs and give them an edge, literally.

The erwin EDGE platform delivers an “enterprise data governance experience.” And at the heart of the erwin EDGE is the erwin Data Intelligence Suite (erwin DI).

erwin DI provides all the tools you need for the effective governance of your data. These include data catalog, data literacy and a host of built-in automation capabilities that take the pain out of data preparation.

With erwin DI, you can automatically harvest, transform and feed metadata from a wide array of data sources, operational processes, business applications and data models into a central data catalog and then make it accessible and understandable via role-based, contextual views.

With the broadest set of metadata connectors, erwin DI combines data management and DG processes to fuel an automated, real-time, high-quality data pipeline.

See for yourself why erwin DI is a DBTA 2020 Readers’ Choice Award winner for best data governance solution with your very own, very free demo of erwin DI.

data governance preparedness

How a Global Broadcaster Deployed Real-Time Automated News Clipping with AWS Media Services

$
0
0

Feed: AWS Partner Network (APN) Blog.
Author: Yo-Han Choi.

By Yo-Han Choi, Sr. Media Solutions Specialist at MegazoneCloud
By Seung-Ryong Kim, Commercial Sales at MegazoneCloud 
By Jin-Ho Jeong, Sr. Media Pre-Sales at MegazoneCloud

The internet has dramatically changed content consumption by continuously introducing new forms of media. Today, television is just one of the many ways people watch content. Audiences can watch what they want, when they want to, on whatever device they want to watch it.

As mobile devices and 5G networks pave the way for diversified content consumption across the globe, the new global media trend poses new challenges to traditional broadcasting companies.

For instance, a global broadcaster based in South Korea produces a wide variety of content spanning international news, economy, culture, and entertainment programs. Since 1997, the broadcaster has been transmitting its contents over cable, satellite, and IPTV to audiences worldwide.

To keep pace with the fast-moving media trend and deliver information rapidly, the company turned to the cloud for transforming its media production system and providing leading-edge services to its audience. The customer adopted state-of-the-art, cloud-based media technology, and undertook an industry-leading digital transformation.

MegazoneCloud, with its expansive technology offerings and expertise in providing cloud solutions, was a natural partner. MegazoneCloud is an AWS Partner Network (APN) Premier Consulting Partner and Managed Service Provider (MSP) with AWS Competencies in Digital Customer Experiences, Financial Services, SAP, and others.

The project described in this post, powered by AWS Media Services, began with the aim to build a state-of-the-art prototype for media production using the AWS Cloud.

About the Live News Creation and Distribution Process

Swift delivery of global online content has always been critical to broadcasters. However, this has not been easy to realize as the content production process usually takes hours, if not days, to complete. In the traditional methodology, the content had to go through a series of labor-intensive processes before transmission.

This process started with recording using broadcasting equipment, included a manual editing process, and was followed by additional preparations such as transcription and translation for online distribution. Therefore, automating these major time-consuming procedures was the key to creating an efficient cloud-based media production system.

In most cases, live news is recorded for 40 minutes, and then goes through manual editing and clipping to turn the continuous video stream into shorter, topic-based news segments. This was a painstaking task in which the editor needed to watch the video closely and decide where the video should be split.

In fact, this was the method most broadcasting companies, including our customer, used to edit its content to be uploaded on the internet.

MegazoneCloud-Media-Services-1

Figure 1 – The production process following the recording.

Testing and Prototyping the Solution

Our customer sought to test three main service scenarios:

  • Expedite news production by implementing real-time, automated, live news clipping.
  • Automatically transform the contents of the segmented newsclip into text using speech to text (STT).
  • Automate the process for creating captions and translation into other languages.

To attain these innovative services, cloud-based media and machine learning (ML) services needed to be incorporated into the media production process. Building this complex architecture required a close collaboration and in-depth discussions between MegazoneCloud and our customer in Korea.

To fulfill the customer’s first goal of automating news clipping, the customer and MegazoneCloud decided to employ two Amazon Web Services (AWS) sets of technologies: AWS Media Services and AWS Machine Learning Services.

They wanted to automate the role of editors in judging where a news story starts and ends. By doing this, the time-consuming manual editing process that was repeated throughout the day could be eliminated altogether to create an efficient workflow for faster news distribution.

This diagram shows the prototype’s full architecture:

MegazoneCloud-Media-Services-2

Figure 2 – AWS architecture for auto-clipping.

Deploying AWS Media and Amazon Rekognition

The first step for the prototype was to upload the news contents to AWS for broadcast-grade live video processing using AWS Elemental MediaLive, a solution optimized for media processing.

Building an architecture enabling the step-by-step processes of transcoding, machine learning, transcription, and translation services was no small feat. The main challenge in building this system was the need for it to work in real-time.

As expected, enabling this process for live video was a whole different story from applying it for video-on-demand. The two companies found the answer to this problem by bringing Amazon Rekognition into the picture, which allows users to leverage deep learning even without any in-depth knowledge of machine learning.

By employing this solution, the customer could store a collection of anchorperson or frequently appearing faces under index Faces, and then use AWS Lambda and Amazon DynamoDB to identify and compile a database of where the anchor appears on the video. That would indicate the start of a new story.

Figure 3 – AWS Elemental MediaLive configuration.

An important element that needed to be added to this architecture was the logic for determining where to split the continuous news stream. Although an automated facial recognition analysis can assess the time and location of where the anchor’s face appears in the video, it is not necessarily an exact indicator of where the story begins and ends.

For a more definitive judgement of the news section, a decision logic needed to be set up.

At the same time, the customer wanted to build a serverless architecture. To conform to this requirement, MegazoneCloud decided to execute the logical programming on AWS Lambda. After intensive efforts to run the logic on Lambda, the team succeeded in applying the logic in real-time on the timeframe information stored in Amazon DynamoDB. By leveraging Lambda, the architecture was also built to reduce errors and respond to exceptions.

After the setup, Lambda automated a dynamic series of actual news clipping and editing processes using AWS Elemental MediaConvert. This image shows the auto clipping process from recognizing the anchor’s face to the final clipping.

Figure 4 – Auto-clipping process

The video contents were saved in 1080p and 30fps format using AWS Elemental MediaLive and Real-Time Messaging Protocol (RTMP) to maintain broadcast-quality resolution. AWS Elemental MediaLive and AWS Elemental MediaConvert also allowed the live news recording and video on demand (VOD) news clip service to be provided in the high quality video the customer needed.

By deploying these cloud services, a seamlessly automated live clipping process was brought to life. Now, high definition data streams could be uploaded in real-time to be processed with Amazon Rekognition, and then edited to produce news segments without delay.

Automating Transcription and Multi-Language Translation

The second goal of this project was to execute STT conversion on the processed news contents to produce captions. For this purpose, Amazon Transcribe was activated immediately following the news clipping. When the VOD news segment was saved in Amazon Simple Storage Service (Amazon S3) by AWS Elemental MediaConvert, Lambda would invoke Amazon Transcribe to perform the STT function.

Since the transcription produced by Amazon Transcribe was saved in a JSON file, it needed to be changed into caption formats such as WebVTT, SRT, or SAMI so it could be run simultaneously with the video clip. The WebVTT format was chosen because of its high compatibility with most video players.

To enable the caption to be displayed on the news clip on the video player, a Lambda function was set up to execute the commands to convert the STT data from JSON to WebVTT. After that, the Lambda function would allow the converted caption file to be played with the video clip prepared in HLS format on S3 to be played on an HTML5 Player.

For efficient delivery of the news contents, Amazon CloudFront was employed in the final distribution process. The architecture also allowed the caption to be displayed at the bottom of the screen as the news is played in the customer’s test demo player.

For the third new service, AWS Lambda was configured to run the Amazon Translate function on the text saved as WebVTT. (See Figure 2.) Since the news was reported in English targeting the global audience, the test process was able to produce high-quality STT results and translations.

As seen in the image below, the prototype tested for English to Chinese translation to be displayed in the demo player in sync with the news segment.

Figure 5 – Automated news clipping, transcription, and translation process.

Creating an Efficient, Time-Saving, Live, News Clipping Workflow

The prime benefit of leveraging AWS for the broadcasting process is that it uses managed service platforms on a serverless cloud environment.

MegazoneCloud-Media-Services-6

Figure 6 – Major functions in the broadcasting process.

Automated Clipping Reduces Content Creation and Distribution Time

Broadcasting and media is a technology-intensive industry that employs a wide array of media solutions and IT infrastructure. The news clipping service introduced in this case study was enabled on a serverless architecture without the need for additional infrastructure.

It demonstrates how a serverless, fully managed service on the cloud can transform the broadcasting process, and possibly become a key to leading the broadcasting industry to a new level of growth.

This project demonstrates the potential of the cloud to:

  • Introduce innovative services that adopt the latest media trends.
  • Enhance workflow efficiency.
  • Enable news to be transmitted swiftly through an automated distribution platform.

Conclusion

As a result of this pilot, MegazoneCloud’s customer was able to reduce the time spent on editing the news clip to enable the distribution of the news within minutes. Overall, the automated process created by leveraging ML services improved the broadcaster’s workflow efficiency by eliminating time-consuming manual operations.

The key to implementing these services in such a short time was the infrastructure technology available on the cloud. In fact, AWS Media Services and AWS Machine Learning Services stacks were the major contributors in building the leading-edge services for the customer.

Had this service been built with a systems integration approach, the project would have taken at least a few months. By leveraging the power of AWS, MegazoneCloud was able to produce the desired results in just one month.

As is evident in this example, AWS managed services allow businesses to focus on identifying their needs and building the optimal service platform to realize their goals. By implementing the cloud in the broadcasting process, our customer was able to add a new competitive edge to its services.

We hope this case will become a benchmark for news producers around the world who seek to not only survive but thrive in the digital world.

Please contact us to find out more about MegazoneCloud services.

The content and opinions in this blog are those of the third party author and AWS is not responsible for the content or accuracy of this post.

.
MegazoneCloud-APN-Blog-CTA-1
.


MegazoneCloud – APN Partner Spotlight

MegazoneCloud is an AWS Premier Consulting Partner and MSP. As Korea’s first Premier Partner, MegazoneCloud was awarded APN Partner of the Year honors for APAC, and in Korea for two consecutive years.

Contact MegazoneCloud | Practice Overview

*Already worked with MegazoneCloud? Rate the Partner

*To review an APN Partner, you must be an AWS customer that has worked with them directly on a project.

Amazon CloudFront announces real-time logs

$
0
0

Feed: Recent Announcements.

CloudFront has supported delivery of access logs to customer’s Amazon S3 buckets and the logs are typically delivered in a matter of minutes. However, some customers have time sensitive use cases and require access log data quickly. With the new real-time logs, data is available to you in a matter of a few seconds with additional configurability. For example, you can choose the fields you need in the logs, enable logs for specific path patterns (cache behaviors), and choose the sampling rate (the percentage of requests that are included in the logs). The CloudFront real-time logs integrate with Kinesis Data Streams, enabling you collect, process, and deliver log data instantly. You can also easily deliver these logs to a generic HTTP endpoint using Amazon Kinesis Data Firehose. Amazon Kinesis Data Firehose can deliver logs to Amazon S3, Amazon Redshift, Amazon Elasticsearch Service, and service providers like Datadog, New Relic, and Splunk. Using these logs, you can create real-time dashboards, set up alerts, and investigate anomalies or respond to operational events quickly. With today’s release, CloudFront has optimized the console experience for access logs with a separate Logs page to manage your log configurations from a central page. From the Logs page, you can create real-time log configurations and apply them to any cache behavior within your CloudFront distributions.

This feature is available for immediate use and can be enabled via the CloudFront Console, SDK, and CLI. CloudFormation support will be available shortly after this release. For more information, refer to the CloudFront Developer Guide and API documentation. The real-time logs are charged based on the number of log lines that CloudFront publishes to your log destination. Information about pricing for the real-time logs can be found on the CloudFront pricing page. The Kinesis Data Stream costs will vary based on your usage and the pricing is available on the pricing page.


Introducing AWS Data Streaming Data Solution for Amazon Kinesis

$
0
0

Feed: Recent Announcements.

Developers want to build a high performance, security compliant, and easy-to-manage streaming solution. This solution shortens your development time by reducing the need for you to: model and provision resources using AWS CloudFormation; set up Amazon CloudWatch alarms, dashboards, and logging; and manually implement streaming data best practices in AWS. 

This solution provides two AWS CloudFormation templates, both of which use Amazon Kinesis Data Streams for streaming storage. One template uses Amazon API Gateway for ingestion and AWS Lambda as a consumer. The second template uses direct ingestion to Kinesis Data Streams from Amazon Elastic Compute Cloud (Amazon EC2), Amazon Kinesis Data Analytics as a consumer, and Amazon Simple Storage Service (Amazon S3) as a storage destination. To learn more about AWS Data Streaming Solution for Amazon Kinesis, see the AWS Solutions Implementation webpage and the GitHub repository.

Additional AWS Solutions are available on the AWS Solutions Implementation webpage, where customers can browse solutions by product category or industry to find AWS-vetted, automated, turnkey reference implementations that address specific business needs.

Quickly Visualize Marketing Analytics and Ads Data with Matillion, Amazon Redshift, and Amazon QuickSight

$
0
0

Feed: AWS Partner Network (APN) Blog.
Author: Karey Graham.

By Karey Graham, Partner Technical Success Manager at Matillion
By Dilip Rajan, Partner Solution Architect at AWS

Google Analytics and Google Ads are popular platforms for customers who need to make data-driven decisions about the performance of their web assets. For prediction, testing, and optimization scenarios, however, customers need a broader and more complete set of analytics.

Amazon Redshift addresses this need by making it easy for you to quickly work with your data in open formats. It provides data security out of the box, and automates common maintenance tasks.

Amazon QuickSight is a fast, fully managed business intelligence service that lets you easily create and publish interactive dashboards that include machine learning (ML) insights.

Matillion is an ideal tool to combine the power and convenience of Amazon Redshift and Amazon QuickSight. It provides cloud-native data integration tools that make loading and transforming data on Amazon Redshift fast, easy, and affordable.

Matillion is an AWS Partner Network (APN) Advanced Technology Partner with the AWS Data & Analytics Competency. Matillion is also Amazon Redshift Service Ready, meaning it has been validated by AWS Partner Solutions Architects for integrating with Amazon Redshift.

In this post, we’ll present a reference architecture and step-by-step instructions for loading and transforming the data from Google Analytics and Google Ads into Amazon Redshift and visualize them on Amazon QuickSight.

Solution Overview

Matillion ETL for Amazon Redshift provides over 85 connectors for loading data into Amazon Redshift from data sources such as cloud and on-premises databases, cloud and software-as-a-service (SaaS) applications, application programming interfaces, files, and NoSQL databases.

Once your data is available is Amazon Redshift, Matillion provides a rich set of capabilities to build complex transformations for visualizations, business intelligence, reporting, and advanced analytics.

While other tools and pipelines also support similar functionality, this solution provides low setup and maintenance for the pipeline, access to large amounts of data by bypassing limits from Google Analytics and Google Ads, and minimizing data privacy risk because the data is encrypted at rest and in transit.

Matillion-Marketing-Analytics-1

Figure 1 – Solution architecture and data flow.

Here is what each component in Matillion ETL for Amazon Redshift does:

  • First, Matillion sends requests to each Google service.
  • Google returns relevant Ads or Analytics data to Matillion.
  • Matillion streams the data as it arrives to the instance of Amazon Simple Storage Service (Amazon S3). The data is not persisted to disk.
  • Once all data is stored in S3, Matillion issues a COPY command to Amazon Redshift, passing the names of the files and other relevant metadata.
  • Amazon Redshift accesses the data and loads it into appropriate target tables.
  • Matillion automatically deletes any files created in S3 during this job execution, whether the operation succeeded or failed.

How to Set Up the Solution Architecture

We’ll walk you through the following steps:

  1. Set up Matillion and Amazon Redshift using an AWS CloudFormation template.
  2. Set up Google Analytics and Google Ads on Matillion ETL for Amazon Redshift.
  3. Load and transform data on Matillion.
  4. Visualize the data on Amazon QuickSight.

Prerequisites

Step 1: Set Up Matillion and Amazon Redshift

Matillion ETL for Amazon Redshift is available on AWS Marketplace. Follow the setup instructions provided with the latest AWS CloudFormation templates. Once you launch the AWS CloudFormation stack, you can move on to Step 2.

By the way, an AWS Matillion Quick Start is available to help you deploy Matillion with a high availability architecture.

Step 2: Set Up Google Analytics and Google Ads on Matillion

In the Matillion environment, the extract and load of data into Amazon Redshift is handled entirely within an orchestration job. Let’s create a job that extracts our Ads and Analytics data from the source and loads it into Amazon Redshift.

Using the right mouse button, select Open Project in Project Explorer, and then select Add Orchestration Job.

Another benefit of Matillion Orchestration jobs is the literal creation of a data pipeline through the use of components and connectors. Each component is completely self-contained, so no additional software installation is required. They are also within the scope of an ordinary Matillion license, so there’s no additional cost for using any component.

With the workspace and components pane now enabled, let’s begin by extracting data from our Ads and Analytics components. Enter the search term Google in the search bar of the components pane to display a list of the components.

Figure 2 – Enter Google in Matillion components pane to see the Google components.

2a: Create Google Ads Query

Let’s begin with the Google Ads Query component. This component allows you to extract data from one or more accounts into your data warehouse to analyze the spend and performance of campaigns/ads and, where appropriate, compare them with your investments on other marketing platforms.

Drag the component from the pane to the Start component to connect them.

Figure 3 – Drag Google Ads Query to the Start component.

You can now configure these fields in Google Ads Query using the Properties pane:

  • Authentication — You must have OAuth set up within your Google account(s) to pass details such as Developer Token and Client Customer ID to the component.
  • Basic/Advanced Mode — You can define how to select the desired dataset from the Ads account. Basic Mode enables a wizard interface composed of fields you can edit, and Advanced Mode allows you to write a SQL statement to define the source and fields to be returned.
  • Data Source — Select a table from a drop-down list composed of Google Ads entities modeled as tables.
  • Data Selection — Choose from one to as many fields as are available based on the data source selected.
  • Data Source Filter — Use a wizard interface to define criteria for the returning dataset. Strings, numbers, dates, and other data types can be defined here.
  • Staging and Target Table — You can define how staging is to be managed, as well as the table in Amazon Redshift the data is ultimately loaded to.

Figure 4 – Configure Google Ads Query properties

After you configure its properties, the Google Ads Query appears inside a green border, signifying it’s in a valid state. You can now extract its data and load it into Amazon Redshift.

Here is some more information about getting started with Google Ads.

2b: Create Google Analytics Query

The Google Analytics Query component uses the Google Analytics API to retrieve data. This data resides in a Google Analytics View, which can then be loaded into a table.

Matillion is dynamic in that it allows you to establish workflow “paths,” in which actions take place in a sequential fashion. Alternatively, you can establish a workflow in which actions take place concurrently. In this case, data from Google Analytics Query is loaded in place after the Google Ads Query has concluded.

Again using the search term Google in the pane, drag the component to the right of Google Ads Query and connect the two components.

Figure 5 – Drag Google Analytics Query to the Start component.

You can now configure the component using the Properties pane. These properties are the same as for Google Ads Query, except for Authentication, which is slightly different:

  • Authentication — If you’re setting up Google Analytics Query under the same account as Google Ads Query, you can choose the same OAuth credentials. If not, complete OAuth set up within your Google account(s) to pass details such as Developer Token and Client Customer ID to the Google Analytics Query components.
  • Basic / Advanced Mode — Basic Mode enables a wizard interface composed of fields you can edit, and Advanced Mode allows you to write a SQL statement to define the source and fields to be returned.
  • Data Source — Select a table from a drop-down list composed of Google Analytics entities modeled as tables.
  • Data Selection — Choose from one to as many fields as are available based on the data source selected.
  • Data Source Filter — Use a wizard interface to define criteria for the returning dataset. Strings, numbers, dates, and other data types can be defined here.
  • Staging and Target Table — You can define how staging is to be managed, as well as the table in Amazon Redshift the data is ultimately loaded to.

After you configure its properties, the Google Analytics Query appears inside a green border, signifying it’s in a valid state. You can now extract its data and load it into Amazon Redshift.

Use the right mouse button on any area in the open space, and then select Run Job.

This completes the build of your orchestration job. Data is extracted from Ads and Analytics and loaded in a raw state to the destination specified in Amazon Redshift.

You can use this job to load any Google Analytics dataset you might have. If you don’t have an Analytics dataset available, Google analytics provides a large dataset you can use for testing.

Step 3: Load and Transform Data on Matillion

In addition to being a method through which data can be loaded to Amazon Redshift from the source, Matillion also allows for the transformation of data as it resides in Amazon Redshift. Data can be cleaned and reverted to a usable state using native Amazon Redshift SQL commands being pushed down from Matillion.

This pushdown architecture allows you to validate the arguments you enter into components. For example, let’s say that when using a Filter component you want to check how the SQL is written when you set the field dayofweek to 1:

Figure 6 – Validating the arguments you enter into a Filter component.

Located on the Properties pane is a tab labeled SQL. After setting the Filter Condition, go there to verify the SQL is being generated in the desired component, and enter it into a Query editor within Amazon Redshift.

Create a Transformation job by selecting the project with the right mouse button and selecting Add Transformation Job from the pop-up menu.

Once in a Transformation job, you can perform four categories of actions: Read, Join, Transform, and Write:

Figure 7 – Four categories of actions in a Transformation job.

To start the transformation flow, read the data as it resides in an Amazon Redshift table, using the Table Input component. Expand the Read folder and drag out the Table Input as the first component on the workspace.

Figure 8 – Select Table Input.

The Table Input component is simple to set up—simply select the fields you want to be read into the Amazon Redshift environment.

Next, you may want to join two different sources of data. You can do this in a number of ways, as indicated by the number of components available in the Join folder. Select the Join component and link two different Table Input components to create a conjoined dataset.

Figure 9 – Use the Join component to combine data from multiple sources

Joins are defined in Matillion with many of the same arguments you would write into a SQL statement:

  • Main Table — The name of the input table, usually the one whose data you wish to preserve in the output.
  • Main Table Alias — A string you define to establish which fields belong to which table(s).
  • Joins — The table the Main Table will be joining to. Here, you also define the alias for the joined table, as well as the type of join (Inner, Left, Right, Full).
  • Join Expressions — The configuration required for how the join is to take place. Define a formula in which fields are evaluated for the resulting dataset.
  • Output Columns — The fields from either table that populate the resulting dataset. The aliases used in the prior fields are used for identification.

With the data selected and joined, Matillion enables you to debug and validate your work in transformations. After the operation is complete, you can navigate to the SQL tab of the Join component to view the SQL statement generated.

Figure 10 – Navigate to the SQL tab of the Join component to view the SQL statement generated.

You can then compare the SQL statement to already-existing code used in the Query editor. You can also choose to write your own verification query in a SQL Query component. With confidence the SQL code is valid, you can transform the data in a way that derives value from the dataset.

Next, do the same with the Calculator component inside the Transform folder.

Figure 11 – Repeat with the Calculator component.

Using the Calculator component, you have the ability to research native Amazon Redshift functions. After selecting a function, you can write out an expression that can replace the values of an already-existing column, or create a new column with the values defined in an expression.

In the example below, the search term if is used to research the functions available. Highlighting the returned function NULLIF, you can see a description, syntax, and a link to official Amazon Redshift documentation that explains how to write such a function.

The function for NULLIF was written on an already-existing column, year. By specifying year_revised as the name of the expression, this function creates a new field with the resulting evaluation on the year field.

The data has been read from Amazon Redshift, joined on a mutual field, and updated based on a set of conditions. The finalized dataset can be saved into a new database object in the Amazon Redshift instance.

Within the Write category of components, you have a variety of options available for how the data is to be written back into Amazon Redshift. Create a view of the resulting dataset by dragging the Create View component as the next and final step in the workflow.

Figure 12 – Draft the Create View component into the flow.

After you define the name of the new view in the component, the job will be in a valid state (green border), and ready to be run. Move the right mouse button anywhere in the workspace and select Run Job.

Step 4: Visualize Data Using Amazon QuickSight

To visualize the data in Amazon QuickSight, create a new analysis and select the Amazon Redshift table where the final data set of the transform job resides.

You can choose to write a custom query and directly query your data from Amazon Redshift. You can also select various visual types such as heat maps and pie charts to build your Amazon QuickSight dashboard.

Conclusion

You can easily import Google Ads and Analytics data into an Amazon Redshift instance, and transform it into a usable state with Matillion. With its wizard-based interface, gone are the days of needing to memorize the structure of the incoming dataset and destination.

Users with no technical background are empowered to build out their pipelines so their data can be stored in Amazon Redshift and visualized in Amazon QuickSight.

The combination and Amazon Redshift and Amazon QuickSight gives you a scalable, secure, and fully-managed way to get the marketing analytics you need. You can extend this solution to add more data sources from other marketing channels to derive a complete picture of your organization’s marketing efforts and campaigns.

Matillion ETL for Amazon Redshift is available on AWS Marketplace.

.
Matillion-APN-Blog-CTA-1
.


Matillion – APN Partner Spotlight

Matillion is an AWS Competency Partner that delivers modern, cloud-native data integration technology designed to solve top business challenges.

Contact Matillion | Solution Overview | AWS Marketplace

*Already worked with Matillion? Rate the Partner

*To review an APN Partner, you must be an AWS customer that has worked with them directly on a project.

How to Use the New Redis Data Source for Grafana Plug-in

$
0
0

Feed: Redis.
Author: Mikhail Volkov.

Earlier this month, Redis Labs released the new Redis Data Source for Grafana plug-in, which connects the widely used open source application monitoring tool to Redis. To give you an idea of how it all works, let’s take a look at a self-referential example: using the plug-in to see how many times it has been downloaded over time. (The Grafana plug-in repository itself does not provide such statistics out of the box.)

Want to learn more? Read Introducing the Redis Data Source Plug-in for Grafana

What is the Redis Data Source for Grafana?

If you’re not familiar with Grafana, it’s a very popular tool used to build dashboards to monitor applications, infrastructures, and software components. The Redis Data Source for Grafana is a plug-in that allows users to connect to the Redis database and build dashboards in Grafana to easily monitor Redis data. It provides an out-of-the-box predefined dashboard, but also lets you build customized dashboards tuned to your specific needs. 

Hourly downloads of the Redis Data Source for Grafana plug-in.

The Redis Data Source for Grafana plug-in can be installed using grafana-cli, Docker, or used in the Grafana Cloud. Alternatively the plug-in can be built from scratch following the instructions on GitHub.

grafana-cli plugins install redis-datasource

Prerequisites

This demo uses:

How to retrieve Grafana plug-in information

Information about any registered plug-in in a Grafana repository can be retrieved using the API in JSON format:

GET https://grafana.com/api/plugins/redis-datasource/versions/latest
{
  "id": 2613,
  "pluginId": 639,
  "pluginSlug": "redis-datasource",
  "version": "1.1.2",
  "url": "https://github.com/RedisTimeSeries/grafana-redis-datasource/",
...
  "downloads": 1153,
  "verified": false,
  "status": "active",
  "packages": {
    "any": {
      "md5": "ea0a2c9cb11c9fad66703ba4291e61cb",
      "packageName": "any",
      "downloadUrl": "/api/plugins/undefined/versions/1.1.2/download"
    }
  },

For this example, I wanted to find out how many times Redis Data Source for Grafana plug-in was downloaded per day, and to look for spikes after we tweeted or posted on the Redis Labs blog about it. I decided to use RedisTimeSeries (a Redis module that adds a time-series data structure to Redis) to track the number of downloads every hour.

To populate the data I used the TS.ADD command with an automatic timestamp and labels `plugin` and `version`. X is a number of downloads and the latest version `1.1.2` retrieved from API. Labels will be used later to query the time series.

127.0.0.1:6379> ts.add redis-datasource * X LABELS plugin redis-datasource version 1.1.2

I wrote a simple script using ioredis and Axios libraries to call the API and use plug-in information to add time-series samples:

/**
 * A robust, performance-focused and full-featured Redis client for Node.js.
 *
 * @see https://github.com/luin/ioredis
 */
const Redis = require("ioredis");

/**
 * Promise based HTTP client for the browser and node.js
 *
 * @see https://github.com/axios/axios
 */
const axios = require("axios");

/**
 * You can also specify connection options as a redis:// URL or rediss:// URL when using TLS encryption
 */
const redis = new Redis("redis://localhost:6379");

/**
 * Main
 *
 * @async
 * @param {string} plugin Plugin name
 */
async function main(plugin) {
  /**
   * Get Plugin's data
   *
   * @see https://grafana.com/api/plugins/redis-datasource/versions/latest
   */
  const response = await axios.get(
    `https://grafana.com/api/plugins/${plugin}/versions/latest`
  );

  /**
   * Response
   */
  const data = response.data;
  if (!data) {
    console.log("Where is the data?");
    return;
  }

  /**
   * Add Time-series sample with plugin and version labels
   */
  await redis.send_command(
    "TS.ADD",
    data.pluginSlug,
    "*",
    data.downloads,
    "LABELS",
    "plugin",
    data.pluginSlug,
    "version",
    data.version
  );

  /**
   * Close Redis connection
   */
  await redis.quit();
}

/**
 * Start
 */
main("redis-datasource");

My script environment 

I used a package.json file to install dependencies and ran commands using `npm` as shown here:

{
  "author": "Mikhail Volkov",
  "dependencies": {
    "axios": "^0.19.2",
    "ioredis": "^4.17.3"
  },
  "description": "Get statistics for Grafana Plugin",
  "devDependencies": {
    "@types/node": "^14.0.27"
  },
  "license": "ISC",
  "name": "grafana-plugin-stats",
  "scripts": {
    "redis-cli": "docker exec -it redistimeseries redis-cli",
    "start": "docker-compose up",
    "start:app": "node grafana-plugin-stats.ts"
  },
  "version": "1.0.0"
}

To orchestrate Docker containers, I used docker-compose:

  • The Redis service is based on a redislabs/redistimeseries image, which has the RedisTimeSeries module enabled.
  • The Grafana service uses the latest Grafana release with the Redis Data Source plug-in installed from the repository.
version: "3.4"

services:
  redis:
    container_name: redistimeseries
    image: redislabs/redistimeseries:latest
    ports:
      - 6379:6379

  grafana:
    container_name: grafana
    image: grafana/grafana:latest
    ports:
      - "3000:3000"
    environment:
      - GF_AUTH_ANONYMOUS_ORG_ROLE=Admin
      - GF_AUTH_ANONYMOUS_ENABLED=true
      - GF_AUTH_BASIC_ENABLED=false
      - GF_ENABLE_GZIP=true
      - GF_INSTALL_PLUGINS=redis-datasource

To run the script every hour and collect the download data, I used crontab on the Linux server in the cloud:

root@grafana:~# crontab -l
5 * * * * node /root/grafana-plugin-stats/stats.ts

Testing the Redis Data Source for Grafana plug-in

To run the script and collect data, you need to install Node.js, Docker, and Docker Compose, following the instructions for your operating system: 

> docker-compose up -d

Starting grafana         ... done
Starting redistimeseries ... done
...
redistimeseries | 1:M 08 Aug 2020 21:13:20.405 * <timeseries> Redis version found by RedisTimeSeries : 6.0.1 - oss
...
grafana    | installing redis-datasource @ 1.1.2
grafana    | from: https://grafana.com/api/plugins/redis-datasource/versions/1.1.2/download
...
grafana    | t=2020-08-08T21:13:23+0000 lvl=info msg="Registering plugin" logger=plugins name=Redis
grafana    | t=2020-08-08T21:13:23+0000 lvl=info msg="HTTP Server Listen" logger=http.server address=[::]:3000 protocol=http subUrl= socket=

After running the script, we can check the RedisTimeSeries data using the TS.MRANGE command. You can query a range across multiple time-series by using filters in forward or reverse directions:

127.0.0.1:6379> ts.mrange - + withlabels filter plugin=redis-datasource
1) 1) "diff:redis-datasource"
   2) 1) 1) "value"
         2) "diff"
      2) 1) "type"
         2) "datasource"
      3) 1) "plugin"
         2) "redis-datasource"
      4) 1) "version"
         2) "1.1.2"
   3)   1) 1) (integer) 1597125602559
           2) 0
        2) 1) (integer) 1597129202847
           2) 1
        3) 1) (integer) 1597132802738
           2) 10

The command TS.MRANGE with filter `plugin` retrieves samples only for the `redis-datasource` plug-in. Use the option WITHLABELS to return labels.

How to display RedisTimeSeries data in Grafana

Open Grafana in a web browser using `http://localhost:3000` and create the data source by selecting Configuration -> Data Sources. Redis Data Source for Grafana supports transport layer security (TLS) and can connect to open source Redis OSS, Redis Enterprise, and Redis Enterprise Cloud databases anywhere using a direct connection.

Adding Redis Data Source to Grafana configuration information.

The next step is to create a dashboard with a graph panel to visualize data. Select “Redis Datasource” and “RedisTimeSeries commands” in the query editor. Use the command TS.MRANGE with a plug-in name filter.

A graph panel to visualize data using Redis Data Source.

Finally, I named the plug-in Legend Labels and set the version as Value Label, which will make it easier to display the series for later versions of Redis Data Source for Grafana.

Checking the results

Use the command TS.INFO to see the information and statistics for the time series. So far I have collected download data for 250 hours and can see how much memory (in bytes) was allocated to store time-series and other information.

127.0.0.1:6379> ts.info diff:redis-datasource
 1) totalSamples
 2) (integer) 250
 3) memoryUsage
 4) (integer) 4313
 5) firstTimestamp
 6) (integer) 1597125602559
 7) lastTimestamp
 8) (integer) 1598022003033
 9) retentionTime
10) (integer) 0
11) chunkCount
12) (integer) 1
13) maxSamplesPerChunk
14) (integer) 256
15) labels
16) 1) 1) "value"
       2) "diff"
    2) 1) "type"
       2) "datasource"
    3) 1) "plugin"
       2) "redis-datasource"
    4) 1) "version"
       2) "1.1.2"
17) sourceKey
18) (nil)
19) rules
20) (empty list or set)

At the time of publication, Redis Data Source for Grafana plug-in has been downloaded more than 3500 times! We have received valuable feedback from the community and continue developing new features for the data source.

For more information, look at the GitHub repository for the project and let us know if you have any questions in the issues.

Conclusion

I hope this post, and my example using the Redis Data Source for Grafana to track downloads of the plug-in over time, has demonstrated the power and ease of use of this new tool and inspires your to monitor your application data (transactions, streams, queues, etc.) using RedisTimeSeries. Stay tuned for more posts on how and why to use the Redis Data Source for Grafana plug-in.

Streaming backups in parallel using tee

$
0
0

Feed: Planet MySQL
;
Author: Paul Moen
;

So you need to build a new set of databases, perhaps in a new location or geographical zone. Management wants it done yesterday cause the newly updated service hit the front page of reddit and your website and its back-end databases are getting smashed.

The standard method would be to stream a backup from the master or a dedicated backup slave and build each new read only slave from that backup.

You tried streaming the backups in parallel using pssh because some random database blog said you can. https://dbadojo.com/2020/08/26/streaming-backups-in-parallel-using-pssh/

But that failed with a python memory error, you don’t want to use the split workaround and management are still screaming at you….so you search again…

Thinking of the basic requirements, you want one stream of data (from the backup) to go to multiple locations. So you want a linux utility which can redirect streams… enter the venerable tee command.
Tee will redirect a stream from a pipe to as many locations as you want, with the last stream going to a file or that webscale file called /dev/null.

Example of streaming a backup to two locations:

mariabackup --backup --slave-info --tmpdir=/tmp --stream=xbstream 
--parallel=4 --datadir=/var/lib/mysql 2>backup.log | tee 
>(ssh -q 192.168.56.112 -t "mbstream --directory=/var/lib/mysql -x --parallel=4") 
>(ssh -q 192.168.56.113 -t "mbstream --directory=/var/lib/mysql -x --parallel=4") 
> /dev/null

This command will split the streamed backup into two ssh commands which connect to two hosts, and run the mbstream -x command to create an unprepared backup in the datadir.
If you have more hosts, it is just a matter of adding redirections and the associated commands.

One space and performance improvement would be to add pigz to parallel compress before the tee and in each tee’ed ssh command.

Until next time.

Full example: Parallel streaming backup using tee.

-- Split standard input into separate parallel streams using tee

mariabackup --backup --slave-info --tmpdir=/tmp --stream=xbstream --parallel=4 --datadir=/var/lib/mysql 2>backup.log | tee >(ssh -q 192.168.56.112 -t "mbstream --directory=/var/lib/mysql -x --parallel=4") >(ssh -q 192.168.56.113 -t "mbstream --directory=/var/lib/mysql -x --parallel=4") > /dev/null

-- Use pssh to run prepare in parallel. This is a better use case for pssh

[root@db1 test_db]# pssh -i --host='192.168.56.112 192.168.56.113' "mariabackup --prepare --target-dir=/var/lib/mysql"
[1] 05:10:23 [SUCCESS] 192.168.56.112
Stderr: mariabackup based on MariaDB server 10.4.14-MariaDB Linux (x86_64)
[00] 2020-08-31 05:10:22 cd to /var/lib/mysql/
[00] 2020-08-31 05:10:22 This target seems to be not prepared yet.
[00] 2020-08-31 05:10:22 mariabackup: using the following InnoDB configuration for recovery:
[00] 2020-08-31 05:10:22 innodb_data_home_dir = .
[00] 2020-08-31 05:10:22 innodb_data_file_path = ibdata1:12M:autoextend
[00] 2020-08-31 05:10:22 innodb_log_group_home_dir = .
[00] 2020-08-31 05:10:22 InnoDB: Using Linux native AIO
[00] 2020-08-31 05:10:22 Starting InnoDB instance for recovery.
[00] 2020-08-31 05:10:22 mariabackup: Using 104857600 bytes for buffer pool (set by --use-memory parameter)
2020-08-31 5:10:22 0 [Note] InnoDB: Mutexes and rw_locks use GCC atomic builtins
2020-08-31 5:10:22 0 [Note] InnoDB: Uses event mutexes
2020-08-31 5:10:22 0 [Note] InnoDB: Compressed tables use zlib 1.2.7
2020-08-31 5:10:22 0 [Note] InnoDB: Number of pools: 1
2020-08-31 5:10:22 0 [Note] InnoDB: Using SSE2 crc32 instructions
2020-08-31 5:10:22 0 [Note] InnoDB: Initializing buffer pool, total size = 100M, instances = 1, chunk size = 100M
2020-08-31 5:10:22 0 [Note] InnoDB: Completed initialization of buffer pool
2020-08-31 5:10:22 0 [Note] InnoDB: page_cleaner coordinator priority: -20
2020-08-31 5:10:22 0 [Note] InnoDB: Starting crash recovery from checkpoint LSN=2008409552
2020-08-31 5:10:22 0 [Note] InnoDB: Last binlog file './mysql-bin.000003', position 172310127
[00] 2020-08-31 05:10:22 Last binlog file ./mysql-bin.000003, position 172310127
[00] 2020-08-31 05:10:23 completed OK!
[2] 05:10:23 [SUCCESS] 192.168.56.113
Stderr: mariabackup based on MariaDB server 10.4.14-MariaDB Linux (x86_64)
[00] 2020-08-31 05:10:22 cd to /var/lib/mysql/
[00] 2020-08-31 05:10:22 This target seems to be not prepared yet.
[00] 2020-08-31 05:10:22 mariabackup: using the following InnoDB configuration for recovery:
[00] 2020-08-31 05:10:22 innodb_data_home_dir = .
[00] 2020-08-31 05:10:22 innodb_data_file_path = ibdata1:12M:autoextend
[00] 2020-08-31 05:10:22 innodb_log_group_home_dir = .
[00] 2020-08-31 05:10:22 InnoDB: Using Linux native AIO
[00] 2020-08-31 05:10:22 Starting InnoDB instance for recovery.
[00] 2020-08-31 05:10:22 mariabackup: Using 104857600 bytes for buffer pool (set by --use-memory parameter)
2020-08-31 5:10:22 0 [Note] InnoDB: Mutexes and rw_locks use GCC atomic builtins
2020-08-31 5:10:22 0 [Note] InnoDB: Uses event mutexes
2020-08-31 5:10:22 0 [Note] InnoDB: Compressed tables use zlib 1.2.7
2020-08-31 5:10:22 0 [Note] InnoDB: Number of pools: 1
2020-08-31 5:10:22 0 [Note] InnoDB: Using SSE2 crc32 instructions
2020-08-31 5:10:22 0 [Note] InnoDB: Initializing buffer pool, total size = 100M, instances = 1, chunk size = 100M
2020-08-31 5:10:22 0 [Note] InnoDB: Completed initialization of buffer pool
2020-08-31 5:10:22 0 [Note] InnoDB: page_cleaner coordinator priority: -20
2020-08-31 5:10:22 0 [Note] InnoDB: Starting crash recovery from checkpoint LSN=2008409552
2020-08-31 5:10:22 0 [Note] InnoDB: Last binlog file './mysql-bin.000003', position 172310127
[00] 2020-08-31 05:10:23 Last binlog file ./mysql-bin.000003, position 172310127
[00] 2020-08-31 05:10:23 completed OK!

-- change ownership in parallel.

[root@db1 test_db]# pssh -i --host='192.168.56.112 192.168.56.113' "chown -R mysql:mysql /var/lib/mysql"
[1] 05:10:41 [SUCCESS] 192.168.56.112
[2] 05:10:41 [SUCCESS] 192.168.56.113

-- start databases in parallel.

[root@db1 test_db]# pssh -i --host='192.168.56.112 192.168.56.113' "systemctl start mariadb"
[1] 05:10:48 [SUCCESS] 192.168.56.112
[2] 05:10:48 [SUCCESS] 192.168.56.113

-- check the status of databases ... you guessed it, in parallel.

[root@db1 test_db]# pssh -i --host='192.168.56.112 192.168.56.113' "systemctl status mariadb"
[1] 05:10:53 [SUCCESS] 192.168.56.112
● mariadb.service - MariaDB 10.4.14 database server
Loaded: loaded (/usr/lib/systemd/system/mariadb.service; disabled; vendor preset: disabled)
Drop-In: /etc/systemd/system/mariadb.service.d
└─migrated-from-my.cnf-settings.conf
Active: active (running) since Mon 2020-08-31 05:10:48 UTC; 4s ago
Docs: man:mysqld(8)
https://mariadb.com/kb/en/library/systemd/
Process: 4219 ExecStartPost=/bin/sh -c systemctl unset-environment _WSREP_START_POSITION (code=exited, status=0/SUCCESS)
Process: 4163 ExecStartPre=/bin/sh -c [ ! -e /usr/bin/galera_recovery ] && VAR= || VAR=`cd /usr/bin/..; /usr/bin/galera_recovery`; [ $? -eq 0 ] && systemctl set-environment _WSREP_START_POSITION=$VAR || exit 1 (code=exited, status=0/SUCCESS)
Process: 4161 ExecStartPre=/bin/sh -c systemctl unset-environment _WSREP_START_POSITION (code=exited, status=0/SUCCESS)
Main PID: 4186 (mysqld)
Status: "Taking your SQL requests now..."
CGroup: /system.slice/mariadb.service
└─4186 /usr/sbin/mysqld

Aug 31 05:10:48 db2 systemd[1]: Starting MariaDB 10.4.14 database server...
Aug 31 05:10:48 db2 mysqld[4186]: 2020-08-31 5:10:48 0 [Note] /usr/sbin/mysqld (mysqld 10.4.14-MariaDB-log) starting as process 4186 ...
Aug 31 05:10:48 db2 mysqld[4186]: 2020-08-31 5:10:48 0 [Warning] Could not increase number of max_open_files to more than 16384 (request: 32183)
Aug 31 05:10:48 db2 systemd[1]: Started MariaDB 10.4.14 database server.
[2] 05:10:53 [SUCCESS] 192.168.56.113
● mariadb.service - MariaDB 10.4.14 database server
Loaded: loaded (/usr/lib/systemd/system/mariadb.service; disabled; vendor preset: disabled)
Drop-In: /etc/systemd/system/mariadb.service.d
└─migrated-from-my.cnf-settings.conf
Active: active (running) since Mon 2020-08-31 05:10:48 UTC; 4s ago
Docs: man:mysqld(8)
https://mariadb.com/kb/en/library/systemd/
Process: 4225 ExecStartPost=/bin/sh -c systemctl unset-environment _WSREP_START_POSITION (code=exited, status=0/SUCCESS)
Process: 4169 ExecStartPre=/bin/sh -c [ ! -e /usr/bin/galera_recovery ] && VAR= || VAR=`cd /usr/bin/..; /usr/bin/galera_recovery`; [ $? -eq 0 ] && systemctl set-environment _WSREP_START_POSITION=$VAR || exit 1 (code=exited, status=0/SUCCESS)
Process: 4167 ExecStartPre=/bin/sh -c systemctl unset-environment _WSREP_START_POSITION (code=exited, status=0/SUCCESS)
Main PID: 4192 (mysqld)
Status: "Taking your SQL requests now..."
CGroup: /system.slice/mariadb.service
└─4192 /usr/sbin/mysqld

Aug 31 05:10:48 db3 systemd[1]: Starting MariaDB 10.4.14 database server...
Aug 31 05:10:48 db3 mysqld[4192]: 2020-08-31 5:10:48 0 [Note] /usr/sbin/mysqld (mysqld 10.4.14-MariaDB-log) starting as process 4192 ...
Aug 31 05:10:48 db3 mysqld[4192]: 2020-08-31 5:10:48 0 [Warning] Could not increase number of max_open_files to more than 16384 (request: 32183)
Aug 31 05:10:48 db3 systemd[1]: Started MariaDB 10.4.14 database server.

How to Build a Real-Time Gaming Leaderboard with Amazon DynamoDB and Rockset

$
0
0

Feed: AWS Partner Network (APN) Blog.
Author: Kehinde Otubamowo.

By Kehinde Otubamowo, Solutions Architect at AWS
By Shruti Bhat, SVP Product at Rockset

In this post, we will show you how to build a serverless microservice—a gaming leaderboard—that runs real-time search, aggregations, and joins on Amazon DynamoDB data.

Amazon DynamoDB is a fully-managed, serverless key-value and document database that delivers single-digit millisecond performance at any scale. Game developers build on Amazon DynamoDB for its scalability, durability, and consistency.

For microservices that predominantly write data, DynamoDB provides an “always on” experience at scale without the need for careful capacity planning, resharding, and database maintenance. These capabilities make DynamoDB a popular database service for various parts of game platforms like player data, game state, session history, and leaderboards.

To incentivize players, game developers turn to real-time interactive leaderboards, which can be microservices and operate independently from the core game design. A leaderboard entices competition among players by continuously adding, removing, and updating rankings across millions of users concurrently to display users’ relative placement in real-time.

Leaderboards require complex analytical queries that aggregate and join multiple aspects of game play in real-time for millions of concurrent gamers.

Key-value stores were not designed for analytics and support a limited number of query operators and indexes. That’s why it’s a best practice to pair Amazon DynamoDB with an analytics solution like Rockset that automatically indexes your data for fast search, aggregations, and joins at scale.

Rockset is an AWS Partner Network (APN) Select Technology Partner whose real-time indexing database in the cloud is used for real-time analytics at scale.

Amazon DynamoDB is Built for Write-Heavy Workloads at Scale

Game developers select Amazon DynamoDB for scalability and simplicity. Pennypop, the game developer behind Battle Camp, used DynamoDB to scale to 80,000+ requests per second. Clash of Clans, another developer, used DynamoDB to scale to tens of millions of players a day.

With DynamoDB, developers get the same single-digit millisecond performance at any scale, supporting peaks of more than 20 million requests per second. Furthermore, operating a game at scale does not come with overhead costs as DynamoDB is serverless.

Like other NoSQL databases, speed and scale come at the expense of flexibility. DynamoDB requires developers to identify the access patterns of their application and limit the number of data requests over the network.

For example, when retrieving game session information, it’s a best practice to retrieve start times, end times, users, and other properties using a single query. Designing the data model in DynamoDB requires forethought of what data properties will need to be retrieved, and when, in a gaming application.

For core gaming features, optimizing for the access patterns of the application is necessary to achieve speed at scale. For other analytical use cases where a couple seconds of data delay is sufficient, it makes sense to pair DynamoDB with a system that has greater flexibility at query time and support for search, aggregations, and joins.

Rockset is Built for Read-Heavy Workloads at Scale

Offloading read-heavy microservices gives game developers greater flexibility, as the data model used for writes does not need to carry over for reads.

As Rockset indexes the data, queries can easily be added or modified without being limited by the data modeling in DynamoDB. This makes it faster and easier to spin up new read-heavy microservices.

Fully Managed Sync to DynamoDB Updates

Rockset adopts the same serverless model as Amazon DynamoDB, obviating the need for software and hardware configuration and maintenance. As the number of new data-driven microservices grows, the infrastructure team at gaming companies can continue to stay lean.

The native integration with DynamoDB ensures new data is reflected and queryable in Rockset with only a few seconds delay. For read-heavy workloads, such as leaderboards, this allows game players to get updated scores within a couple of seconds.

Rockset uses a built-in connector with DynamoDB streams API for the data to constantly stay in sync. DynamoDB tables are initially linearly scanned, and then Rockset switches to the streams API to maintain a time-ordered queue of updates. With Rockset’s built-in connector to DynamoDB, a game developer does not need to build or manage their own integration with DynamoDB streams.

Automated Indexing for Fast Search, Aggregations, and Joins

Leaderboard queries need to aggregate player scores and join attributes across Amazon DynamoDB tables. Gaming data that’s stored in DynamoDB may contain heavily nested arrays and objects, mixed data types, and sparse fields. Many analytical backends require upfront schema definition (if they are SQL databases), or do not support joins (if they support flexible schemas). This can make leaderboard queries challenging to execute.

Rockset has native support for search, aggregation, and joins, and does not require data prep to run queries on JSON, CSV, XML, Avro, or Parquet data. At the time of ingest, Rockset automatically indexes your data in an inverted index for search and filter queries, a column index for large range scans, and a row index for random reads.

Rockset’s custom SQL-based query engine selects the best index for the query, returning searches, aggregations, and joins in milliseconds.

In Rockset, a leaderboard query uses the columnar index, fetching, and aggregating data only from the columns required, such as game scores and the gamer profile. When the dataset has a large number of columns, this leads to significant performance gains over a more traditional row-based approach since only a small fraction of the total data needs to be processed.

In contrast, you may want to use Rockset to search for individual player scores or attributes. These types of queries use the inverted index, fetching a list of records that match a selective predicate (player ID, for example). This means queries using selective predicates in Rockset return in tens of milliseconds regardless of the size of your dataset.

Automated indexing in Rockset provides developers support for a wide range of analytical queries, without cumbersome data cleaning.

Serverless Auto-Scaling for High QPS

Leaderboards need to compute millions of gamers’ positions in near real-time. With a disaggregated underlying architecture, Rockset can scale ingest compute, storage, and query compute independently to support these high queries per second (QPS) workloads.

If you need faster queries and high QPS, Rockset can horizontally scale out resources efficiently for your microservice. Gamers select DynamoDB for the scalability of writes and want the same scalability for reads, without the overhead of infrastructure maintenance.

Leaderboard Architecture

Take a look at the architecture for building a real-time leaderboard using Amazon DynamoDB and Rockset. Gamer-generated data is written to DynamoDB, and the Scan and Stream API keeps Rockset in sync and makes new data queryable with only a two-second delay.

Rockset automatically indexes data and serves complex leaderboard queries at scale.

Rockset-Amazon-DynamoDB-Gaming-1

Figure 1 – Leaderboard architecture.

How to Create a Leaderboard

We generated mock data of a fantasy soccer game to demonstrate how to build a real-time leaderboard using Amazon DynamoDB and Rockset.

The Datasets

Fantasy football or fantasy soccer is a game in which participants assemble an imaginary team of real-life footballers and score points based on those players’ actual statistical performance or their perceived contribution on the field of play. Fantasy games are very popular, with most variants having millions of players worldwide.

In fantasy soccer, points are gained or deducted depending on players’ performances each game week. Points systems vary between games, but points are typically awarded for achievements like scoring a goal, earning an assist, or keeping a clean sheet.

For the purpose of this demo, teams will consist of seven players—a typical selection would include a goalkeeper, four outfield players, and two substitutes. We’ll assign random points to each soccer player each week. To model this game, we used three tables—Gamers, Soccer_Players, and Gamer_Teams.

For demo purposes, we modeled the fantasy soccer demo application with three tables. Note that in most application use cases, you can store related items close together on the same DynamoDB table. For more info, please refer to our documentation on Best Practices for Modeling Relational Data in DynamoDB.

The Gamers table stores information about gamers playing the game.

Rockset-Amazon-DynamoDB-Gaming-2

Figure 2 – Gamers table.

The Soccer_Players table contains information about soccer players that can be selected by gamers each week.

Rockset-Amazon-DynamoDB-Gaming-3

Figure 3 – Soccer_Players table.

Finally, we will store teams selected by each gamer in the Gamer_Teams table.

Rockset-Amazon-DynamoDB-Gaming-4

Figure 4 – Gamer_Teams table.

Integrate DynamoDB and Rockset

There are two steps to create an integration to Amazon DynamoDB:

  1. Configure an AWS Identity and Access Management (IAM) policy with read-only access to your DynamoDB table.
  2. Grant Rockset permission to access your AWS resource through either Cross-Account IAM Roles (recommended) or AWS access keys.

These permissions enable Rockset to read and index the data from DynamoDB. Find the step-by-step integration instructions in the Rockset docs.

Create a Rockset Collection

Rockset uses a document-oriented data model, with collections being the equivalent of tables in the relational world. You can create a collection in the Rockset console or programmatically using the REST API or a client software developer kit (SDK), including Python, Node.js, Java, or Golang.

We will create three collections, one for each of the DynamoDB tables, and give the collection a name, description, and select the DynamoDB table and AWS region.

The names of the collections are: dynamodb_soccer_gamer_teams, dynamodb_soccer_gamers, and dynamodb_soccer_players. A preview of the data is automatically generated as a SQL table.

Rockset-Amazon-DynamoDB-Gaming-5

Figure 5 – A preview of the data is automatically generated as a SQL table.

Leaderboard Query

For the leaderboard, we’ll generate a live, real-time score for the given week that’s made available to gamer teams. If a player scores a goal, the leaderboard will automatically update in near real-time with a new score and ranking of gamer teams.

We’ll also create an API and hit the endpoint every second so the latest scores are captured and displayed in the application. We can write the scores to soccer_score_totals collection to calculate an overall ranking of the gamer teams.

Rockset supports ANSI SQL with certain extensions for nested objects and arrays. You’ll see in the SQL below that we are aggregating the current gamer teams’ scores to display in near real-time.

WITH week_players AS (
SELECT players.id Player, ARRAY_AGG(d.Gamer_ID) Gamers
FROM commons.dynamodb_soccer_gamer_teams d, UNNEST(d.GW_Team.Players id) players
WHERE d.Game_Week = :week
GROUP BY 1),
week_scores AS (
SELECT week_players.Player, week_players.Gamers, ELEMENT_AT(d.Game_Week_Scores, :week) Score
FROM commons.dynamodb_soccer_players d INNER JOIN week_players
 ON d.Player_ID = week_players.Player
 )
SELECT gamers.id Gamer, :week Week, SUM(week_scores.Score) Score
FROM week_scores, UNNEST(week_scores.Gamers id) gamers
GROUP BY 1;

To aggregate the scores, the SQL query makes use of the UNNEST function that can be used to expand arrays or values of documents to be queried. The query also highlights all of the other SQL goodness—sorts, joins, and aggregations.

Here’s the query results generated from the console:

Rockset-Amazon-DynamoDB-Gaming-6

Figure 6 – Query results generated from the console.

We can modify the query above slightly to write the results into a new collection, dynamodb_soccer_score_totals, using the INSERT INTO command. We can use a select * from dynamo_soccer_score_totals to view the weekly results in the console.

INSERT INTO commons.dynamodb_soccer_score_totals
WITH week_players AS (
SELECT players.id Player, ARRAY_AGG(d.Gamer_ID) Gamers
FROM commons.dynamodb_soccer_gamer_teams d, UNNEST(d.GW_Team.Players id) players
WHERE d.Game_Week = :week
GROUP BY 1),
week_scores AS (
SELECT week_players.Player, week_players.Gamers, ELEMENT_AT(d.Game_Week_Scores, :week) Score
FROM commons.dynamodb_soccer_players d INNER JOIN week_players
 ON d.Player_ID = week_players.Player
 )
SELECT gamers.id Gamer, :week Week, SUM(week_scores.Score) Score
FROM week_scores, UNNEST(week_scores.Gamers id) gamers
GROUP BY 1;

Each week, new scores are generated. Rather than use a set value for the week, we can use a parameter in Rockset to specify the values in the SQL query at runtime.

Rockset-Amazon-DynamoDB-Gaming-7

Figure 7 – A parameter in Rockset can specify the values in the SQL query at runtime.

We can sum the total week’s scores to get a ranking of the gamer teams using the query below.

SELECT Gamer, SUM(Score) Total
FROM commons.dynamodb_soccer_score_totals
GROUP BY Gamer
ORDER BY Total DESC

Rockset-Amazon-DynamoDB-Gaming-8

Figure 8 – We can sum the total week’s scores to get a ranking of the gamer teams.

The query we just ran in the Rockset console can be saved as a REST endpoint to create an API, also known as a Query Lambda. We can specify a default parameter value, like week-, or let the default be set at the query runtime. With a Query Lambda, we can save the query and run it directly from the application.

Rockset-Amazon-DynamoDB-Gaming-9

Figure 9 – Save the query and run it directly from the application using a Query Lambda.

We take the Query Lambda and execute it from a curl REST endpoint.

Rockset-Amazon-DynamoDB-Gaming-10

Figure 10 – Execute the Query Lambda from a curl REST endpoint.

Search Query

We can use Rockset’s inverted index to find the total score for a single gamer team. In a fantasy soccer game, this query could be triggered on login to display the gamer team’s score.

WITH gamer_players AS (
SELECT d.Gamer_ID, d.Game_Week, player.id Player
FROM commons.dynamodb_soccer_gamer_teams d, UNNEST(d.GW_Team.Players id) player
WHERE d.Gamer_ID = 'Awboh69638')
SELECT gamer_players.Gamer_ID, SUM(ELEMENT_AT(d.Game_Week_Scores, gamer_players.Game_Week)) Total
FROM commons.dynamodb_soccer_players d INNER JOIN gamer_players
ON d.Player_ID = gamer_players.Player
GROUP BY 1
OrDER BY Total desc

Rockset handles highly-complex search queries involving joins, aggregations, and ordering. These types of queries, even when run on large datasets, return results in milliseconds.

Rockset-Amazon-DynamoDB-Gaming-11

Figure 11 – Search queries, even when run on large datasets, return results in milliseconds.

Summary

With Amazon DynamoDB and Rockset, you have the flexibility to build read-intensive microservices independently of how the data is stored and modeled for the core gaming application.

Developers can synchronize data from DynamoDB to Rockset, run SQL queries on their data, and create APIs without needing to manage indexes, infrastructure, or schemas. The simplicity of Rockset gives developers the ability to quickly iterate on their game development and find new ways to monetize, engage, and grow adoption of their game.

.
Rockset-APN-Blog-CTA-1
.


Rockset – APN Partner Spotlight

Rockset is an APN Select Technology Partner whose real-time indexing database in the cloud is used for real-time analytics at scale.

Contact Rockset | Solution Overview

*Already worked with Rockset? Rate this Partner

*To review an APN Partner, you must be an AWS customer that has worked with them directly on a project.

Top 3 trends in retail software development accelerated by COVID-19

$
0
0

Feed: Big Data Made Simple.
Author: Guest.

The landscape of the retail industry has been already shifting towards optimisation of everyday operations by applying digital technologies. Global retail tech spending was to reach $203.6 billion in 2019, according to Gartner. The COVID-19 outbreak accelerated the beginning of the “new normal” reality, where the use of retail software development services define a company’s position and opportunities in the market.

Retailers should be able to ensure a high-quality shopping experience for diverse customer groups to improve bottom-line results. The recent survey by GlobalWebIndex, a market research company, shows that:

  • 46% of those surveyed will be shopping online more once lockdown measures are lifted
  • 27% of respondents will search for the product online before going to the physical store
  • 49% of people in the survey plan to visit physical stores after the outbreak is over

The adaptation to the post-pandemic retail environment becomes more seamless with the introduction of technologies since it helps to do both:

  • Satisfy the needs of modern customers — who apprehensive about visiting offline stores and prefer to shop online
  • bridge the gap between a brick-and-mortar store and digital world shopping, creating an enjoyable experience

Here are the top three COVID-fuelled tech trends, which adoption helps to gain a competitive edge in the post-pandemic retail sector.

  1. Augmented reality (AR)

Augmented reality (AR) is at the forefront of retail innovation; this applies to the use of AR for customer acquisition in the store as well as virtual modelling, interaction with brands and advertising technologies. According to statistics, 61% of consumers are more likely to choose the retailers who provide AR experience and 40% eager to spend more on a product, which they can customise using AR.

With multiple applications of augmented reality in the retail industry like online shopping personalisation and in-store interactions, etc. growing numbers of companies are turning to AR development solutions.

Augmented online shopping is an alternative to the consumer’s ability to see and touch a product in a physical store. AR provides a customer with a possibility to experience how a piece of furniture will look like in their home — IKEA, Amazon — or try on a product virtually — Pinterest, Sephora. It reduces items return rate and helps to meet customer demands, thus increasing customer loyalty.

AR in-store shopping makes experience more fun and provides additional information about the items by pointing at it. The extra information helps to match product pairings and impacts consumers’ decision-making process. In the times of social distancing AR mirrors and fitting rooms become even more popular, since it not only speeds up the fitting process but also eliminates the need to touch objects.

  1. Machine learning

In 2019, 45% of companies used machine learning algorithms to predict customer shopping behaviour, according to Statista. Machine learning algorithms based on the analysed data make a personalised offer to a consumer before they understand what they want.

In today’s reality, retailers need to keep up with consumers’ shopping habits as well as predict shifts, and machine learning can help them. It offers substantial advantages for enterprises:

  • flexibility and adaptivity as opposed to traditional forecasting methods
  • real-time price optimisation, which increases revenue
  • improved customer segmentation and targeting
  • personalisation powered by analysed data
  • increase of the demand forecasting accuracy

Those and the number of other benefits provoke many retail companies — Amazon, Walmart, Target, Costco, The North Face — to use machine learning algorithms in their day-to-day operations.

  1. Staff-free stores

In the recent report by Shekel, 87% of respondents indicated that they’d rather choose stores with contactless or self-checkout options. Such digital transformation can be achieved with the combination of such technologies as RFID tags, computer vision systems, IoT devices, etc.

Just Walk Out, a cashier-less system developed by Amazon, powered by computer vision, sensor fusion, and deep learning. Once a customer puts products in a shopping cart, the IoT system put them to a virtual cart. The purchase is automatically paid when a customer leaves the store.

Process automation with the help of robots is to help retailers minimise expenses and improve performance. For instance, shelf auditing robots with AI-powered computer vision can scan shelves, providing autonomous monitoring for inventory management and evaluation of items inside the store. Customer service robots can offer personalised answers, assist in the merchandise search, navigate a consumer inside the store and collect information for understanding consumer’s preferences.

With voice recognition technology consumers don’t have to touch any surfaces to perform any action. In today’s zero-touch environment, voice assistants help a customer to get an item or any necessary data without touch interactions.

To sum it up

The global COVID-19 pandemic has also facilitated the rise of the following retail tech trends:

  • Digital wallet — credit or debit cards are to become disrupted due to the spread of coronavirus. According to Bain, digital payments adoption could increase to 10 percentage points globally in 2025.
  • Cybersecurity — with the increase of digitally performed operations, retailers should ensure that their customers’ information is secured and safe.
  • Autonomous delivery — self-driving vehicles make up for the shortage of drivers and don’t depend on business hours.
  • Artificial intelligence — customer service bots are rapidly deploying. Chatbots make the job simpler for employees, helping consumers to resolve an issue without human intervention.

Emerging technologies integration can become a new source of business innovation and add new revenue streams. Stay up to date on the industry tech trends and best practices to survive and succeed in the market.

Stream CDC into an Amazon S3 data lake in Parquet format with AWS DMS

$
0
0

Feed: AWS Big Data Blog.

Most organizations generate data in real time and ever-increasing volumes. Data is captured from a variety of sources, such as transactional and reporting databases, application logs, customer-facing websites, and external feeds. Companies want to capture, transform, and analyze this time-sensitive data to improve customer experiences, increase efficiency, and drive innovations. With increased data volume and velocity, it’s imperative to capture the data from source systems as soon as they are generated and store them on a secure, scalable, and cost-efficient platform.

AWS Database Migration Service (AWS DMS) performs continuous data replication using change data capture (CDC). Using CDC, you can determine and track data that has changed and provide it as a stream of changes that a downstream application can consume and act on. Most database management systems manage a transaction log that records changes made to the database contents and metadata. AWS DMS reads the transaction log by using engine-specific API operations and functions and captures the changes made to the database in a nonintrusive manner.

Amazon Simple Storage Service (Amazon S3) is the largest and most performant object storage service for structured and unstructured data and the storage service of choice to build a data lake. With Amazon S3, you can cost-effectively build and scale a data lake of any size in a secure environment where data is protected by 99.999999999% of durability.

AWS DMS offers many options to capture data changes from relational databases and store the data in columnar format (Apache Parquet) into Amazon S3:

The second option helps you build a flexible data pipeline to ingest data into an Amazon S3 data lake from several relational and non-relational data sources, compared to just relational data sources support in the former option. Kinesis Data Firehose provides pre-built AWS Lambda blueprints for converting common data sources such as Apache logs and system logs to JSON and CSV formats or writing your own custom functions. It can also convert the format of incoming data from JSON to Parquet or Apache ORC before storing the data in Amazon S3. Data stored in columnar format gives you faster and lower-cost queries with downstream analytics services like Amazon Athena.

In this post, we focus on the technical challenges outlined in the second option and how to address them.

As shown in the following reference architecture, data is ingested from a database into Parquet format in Amazon S3 via AWS DMS integrating with Kinesis Data Streams and Kinesis Data Firehose.

Our solution provides flexibility to ingest data from several sources using Kinesis Data Streams and Kinesis Data Firehose with built-in data format conversion and integrated data transformation capabilities before storing data in a data lake. For more information about data ingestion into Kinesis Data Streams, see Writing Data into Amazon Kinesis Data Streams. You can then query Parquet data in Amazon S3 efficiently with Athena.

Implementing the architecture

AWS DMS can migrate data to and from most widely used commercial and open-source databases. You can migrate and replicate data directly to Amazon S3 in CSV and Parquet formats, and store data in Amazon S3 in Parquet because it offers efficient compression and encoding schemes. Parquet format allows compression schemes on a per-column level, and is future-proofed to allow adding more encodings as they are invented and implemented.

AWS DMS supports Kinesis Data Streams as a target. Kinesis Data Streams is a massively scalable and durable real-time data streaming service that can collect and process large streams of data records in real time. AWS DMS service publishes records to a data stream using JSON. For more information about configuration details, see Use the AWS Database Migration Service to Stream Change Data to Amazon Kinesis Data Streams.

Kinesis Data Firehose can pull data from Kinesis Data Streams. It’s a fully managed service that delivers real-time streaming data to destinations such as Amazon S3, Amazon Redshift, Amazon Elasticsearch Service (Amazon ES), and Splunk. Kinesis Data Firehose can convert the format of input data from JSON to Parquet or ORC before sending it to Amazon S3. It needs reference schema to interpret the AWS DMS streaming data in JSON and convert into Parquet. In this post, we use AWS Glue, a fully managed ETL service, to create a schema in the AWS Glue Data Catalog for Kinesis Data Firehose to reference.

When AWS DMS migrates records, it creates additional fields (metadata) for each migrated record. The metadata provides additional information about the record being migrated, such as source table name, schema name, and type of operation. Most metadata fields add – in their field names (for example, record-type, schema-name, table-name, transaction-id). See the following code:

{
        "data": {
            "MEET_CODE": 5189459,
            "MEET_DATE": "2020-02-21T19:20:04Z",
            "RACE_CODE": 5189459,
            "LAST_MODIFIED_DATE": "2020-02-24T19:20:04Z",
            "RACE_ENTRY_CODE": 11671651,
            "HORSE_CODE": 5042811
        },
        "metadata": {
            "transaction-id": 917505,
            "schema-name": "SH",
            "operation": "insert",
            "table-name": "RACE_ENTRY",
            "record-type": "data",
            "timestamp": "2020-02-26T00:20:07.482592Z",
            "partition-key-type": "schema-table"
        }
    }

Additional metadata added by AWS DMS leads to an error during the data format conversion phase in Kinesis Data Firehose. Kinesis Data Firehose follows Hive style formatting and therefore doesn’t recognize the – character in the metadata field names during data conversion from JSON into Parquet and returns an error message: expected at the position 30 of ‘struct’ but ‘-’ is found. For example, see the following code:

{
	"deliveryStreamARN": "arn:aws:firehose:us-east-1:1234567890:deliverystream/abc-def-KDF",
	"destination": "arn:aws:s3:::abc-streaming-bucket",
	"deliveryStreamVersionId": 13,
	"message": "The schema is invalid. Error parsing the schema:
	 Error: : expected at the position 30 of 'struct<timestamp:string,record-type:string,operation:string,partition-key-type:string,schema-name:string,table-name:string,transaction-id:int>' but '-' is found.",
	"errorCode": "DataFormatConversion.InvalidSchema"
}

You can resolve the issue by making the following changes: specifying JSON key mappings and creating a reference table in AWS Glue before configuring Kinesis Data Firehose.

Specifying JSON key mappings

In your Kinesis Data Firehose configuration, specify JSON key mappings for fields with – in their names. Mapping transforms these specific metadata fields names to _ (for example, record-type changes to record_type).

Use AWS Command Line Interface (AWS CLI) to create Kinesis Data Firehose with the JSON key mappings. Modify the parameters to meet your specific requirements.

Kinesis Data Firehose configuration mapping is only possible through the AWS CLI or API and not through the AWS Management Console.

The following code configures Kinesis Data Firehose with five columns with – in their field names mapped to new field names with _”:

"S3BackupMode": "Disabled",
                    "DataFormatConversionConfiguration": {
                        "SchemaConfiguration": {
                            "RoleARN": "arn:aws:iam::123456789012:role/sample-firehose-delivery-role",
                            "DatabaseName": "sample-db",
                            "TableName": "sample-table",
                            "Region": "us-east-1",
                            "VersionId": "LATEST"
                        },
                        "InputFormatConfiguration": {
                            "Deserializer": {
                                "OpenXJsonSerDe": {
                                "ColumnToJsonKeyMappings":
                                {
                                 "record_type": "record-type","partition_key_type": "partition-key-type","schema_name":"schema-name","table_name":"table-name","transaction_id":"transaction-id"
                                }
                                }

Creating a reference table in AWS Glue

Because Kinesis Data Firehose uses the Data Catalog to reference schema for Parquet format conversion, you must first create a reference table in AWS Glue before configuring Kinesis Data Firehose. Use Athena to create a Data Catalog table. For instructions, see CREATE TABLE. In the table, make sure that the column name uses _ in their names, and manually modify it in advance through the Edit schema option for the referenced table in AWS Glue, if needed.

Use Athena to query the results of data ingested by Kinesis Data Firehose into Amazon S3.

This solution is only applicable in the following use cases:

  • Capturing data changes from your source with AWS DMS
  • Converting data into Parquet with Kinesis Data Firehose

If you want to store data in non-Parquet format (such CSV or JSON) or ingest into Kinesis through other routes, then you don’t need to modify your Kinesis Data Firehose configuration.

Conclusion

This post demonstrated how to convert AWS DMS data into Parquet format and specific configurations to make sure metadata follows the expected format of Kinesis Data Streams and Kinesis Data Firehose. We encourage you to try this solution and take advantage of all the benefits of using AWS DMS with Kinesis Data Streams and Kinesis Data Firehose. For more information, see Getting started with AWS Database Migration Service and Setting up Amazon Kinesis Firehose.

If you have questions or suggestions, please leave a comment.


About the Author

Viral Shah is a Data Lab Architect with Amazon Web Services. Viral helps our customers architect and build data and analytics prototypes in just four days in the AWS Data Lab. He has over 20 years of experience working with enterprise customers and startups primarily in the Data and Database space.


Hazelcast IMDG 4.1 BETA is Released!

$
0
0

Feed: Blog – Hazelcast.
Author: Jiri Holusa.

We are proud to announce the release of Hazelcast IMDG 4.1-BETA-1. It is a step toward the first minor release in the Hazelcast IMDG 4.x product line. Being a beta release, it provides a preview of the features coming in future releases and is not intended for production usage.

Below, we highlight the most notable features and enhancements coming in this release. You can find the whole list of changes in the release notes. If you just can’t wait, download it immediately and get started. We’re very interested in your feedback, so don’t hesitate to reach out to us either via Slack, Google Groups or even Twitter.

Initial SQL Support

In previous releases, Hazelcast IMDG supported querying and aggregating over maps using an SQL-like syntax through the existing query engine. Still, the existing implementation has its limitations and there was a strong voice from the community that it should have additional features. 

By far the biggest feature that we’re delivering in this release is a preview of a brand new, state-of-the-art SQL engine, code named Mustang. In this release, the feature set is limited, but it already includes:

  • Support for many new expressions
  • The ability to efficiently query large amounts of data
  • The option to make use of a new, high-performance concurrent off-heap B+ tree
  • More advanced query optimization

We currently do not support features like joins, sorting and aggregations. However, we are committed to continuing the SQL support effort in the nearest and even long-term future to incrementally deliver the best-distributed SQL engine. 

Additionally, we’re also expanding SQL support to Hazelcast Jet. In the upcoming release, you will be able to create jobs and use SQL to manipulate streams of data (for example, windowing on streaming data).

Wait no more to try out the new gem of Hazelcast IMDG. See the example in SQL Reference Manual chapter.

Deployment of Portable Domain Objects Without Restarts

One of the major pain points in previous releases was if users wanted to use EntryProcessors, Runnables or Callables with their own custom domain object, the domain object class had to be available on the classpath before the member starts. This in turn means that if you wanted to introduce a new domain object, you had to essentially restart the cluster. This posed a significant gap in usability and user convenience.

In this release, we are introducing a GenericRecord API that allows you to build the classes on the fly and eliminate the need for a restart. You can plug in your new object and freely use it right away in your EntryProcessors and Runnables/Callables without further hassle.

Configuration Entries Overwrites Without Configuration File Changes

Imagine you want to deploy Hazelcast IMDG members into Kubernetes. In order for the members to find each other, you need to alter the configuration, even though in a minor way.

hazelcast:
  network:
    kubernetes:
      enabled: true
      service-name: hazelcast

Unfortunately, it’s not that simple since this comes with a few dilemmas like where to put the configuration file and how to ensure its availability all the time and to all pods.

Focusing on improving the experience for flexible setups on-premises or in the cloud, we came up with a mechanism that allows you to overwrite any configuration entries using either an environmental variable or a system property. Using this option, you can reduce the whole process of deploying a configuration file, making all members able to access that resource and worrying about high availability of it down to this:

$ java -Dhz.network.kubernetes.enabled=true -Dhz.network.kubernetes.service-name=hazelcast -jar hazelcast-all-4.1-BETA-1.jar

Discover the full power of the feature in the Overriding Configuration documentation chapter.

Discovery Strategy Auto Detection

Concentrating on the user experience didn’t end with the improvement above but rather enabled us to take usability to the next level. Let’s reuse the Kubernetes configuration example above.

Even though it looks pretty easy already, what happens if you want to try to set up a cluster in AWS or Azure? You have to change the configuration again.

In order to make member discovery even simpler, Hazelcast IMDG introduces a discovery auto-detection mechanism. By specifying one simple configuration line, the member automatically detects in which environment it’s running and automatically chooses the discovery strategy. Therefore, forming a cluster in any of the major cloud vendors can’t be made any simpler than a single configuration entry change. Or can it?

Combined with the configuration override enhancement, we’re talking about further simplification of a one-liner:

$ java -Dhz.network.join.auto-detection.enabled=true -jar hazelcast-all-4.1-BETA-1.jar

While it might seem that this is the end of the simplicity journey, we thought differently. That’s why we made the auto-detection enabled by default and therefore, you are now able to form a cluster in AWS, Azure, GCP, Kubernetes and others via:

$ java -jar hazelcast-all-4.1-BETA-1.jar

or even

$ hz start

First Release of the Command Line Interface

Wait! What is that ‘hz’ command in the example above? Starting with Hazelcast IMDG 4.1-BETA-1, we’ve introduced the first version of the command line interface (CLI). With the first release of the tool, installing Hazelcast IMDG and starting a member has never been easier and is done in 40 seconds.


No more ‘java’ command to ease up the life of our non-Java users.

Currently, the CLI is not intended for production usage but rather allowing developers to get hands-on and familiarize themselves with Hazelcast IMDG as soon as possible. More package managers, functionality and production usage readiness are on the roadmap.

Parallel Migrations and Improved Failure Detection Mechanisms

In distributed systems, network failures or environmental instability is inevitable. One of the key strengths of Hazelcast IMDG has always been reliability and resilience against those scenarios. Hazelcast IMDG cluster handles them automatically with no user interaction required.

In the latest release, we invested in improving those mechanisms even more with two major enhancements: parallel partition migrations and partial member disconnection resolution.

Newly, Hazelcast IMDG members do the migrations in parallel. That results in a drastic reduction of time needed for rebalancing to complete if a failure within the cluster happens. Thus, shortening the time the cluster is in a suboptimal state. As an example, according to our tests, should a network disconnect one node in a 10-node cluster responsible for storing four terabytes of data, Hazelcast IMDG will be able to complete partition rebalancing in approximately 2 minutes when it would have previously required at least 33 minutes. 

In addition to improvements on “after something bad happened,” we made the “if something bad happened” part smarter as well. With the help of the Bron-Kerbosch algorithm, the cluster is now able to detect more complicated failures, such as a member being able to connect only to some members of the cluster but not all of them. In that case, the cluster will “kick out” the misbehaving member and ensure stability.

Both of the improvements above come out-of-the-box, so you start benefiting from them as soon as you upgrade to the GA version of IMDG 4.1 once it’s available.

Better CP Management Capabilities

Back in the 3.12 release, Hazelcast IMDG introduced the CP subsystem offering strong consistency guarantees for use cases where it matters the most. Since then, we continued improving the CP subsystem which resulted in it becoming the most popular Java implementation of the Raft algorithm.

This release follows up on that trend and brings a new CP Subsystem listener API. Using it, you can now watch, and therefore immediately react to, events such as a Raft member added or removed, a decrease in the level of availability or Raft majority group completely lost. Leveraging those APIs can ensure that your critical, strongly consistent infrastructure’s failures never go unnoticed and unhandled properly.

Security Improvements (Enterprise Only)

Enterprise edition now benefits from out-of-the-box support for member and client authentication based on Kerberos. This feature uses the JAAS login module from Hazelcast 4.0 and allows integration with LDAP for role mapping. In summary, plugin Hazelcast IMDG into your Kerberos authentication standard has never been easier.

We’re also providing support for audit logging, so integrating Hazelcast into environments with strict standards and legal requirements becomes more straightforward.

Optane Improvements (Enterprise Only)

Continuing to build on our partnership with Intel®, we focused on improving our support with Intel® Optane™ Persistence Memory Modules. Not only have we fixed an issue with exploiting the full capacity of all installed modules on the system, Hazelcast IMDG now provides performance tuning options to get the speed of Optane™ up by even 50% for some use cases, providing near-RAM like speeds.

To be more specific, we found out that Optane™’s performance can be quite hit by NUMA remote access. In order to overcome this, we introduced thread affinity to be able to specify the mapping between threads and NUMA nodes. While thread affinity is targeted at very experienced users, the benefits for Optane™ are promising and should help to squeeze out every last drop of performance.

What’s Next?

Now that beta release is out, we’re switching into the stabilization phase to fix all the bugs to ensure the world-class quality and reliability that Hazelcast IMDG always provided. We expect to release the GA version in late October/early November. Stay tuned!

Closing Words

We would be tremendously grateful for your feedback. Once again, don’t hesitate to reach out via Slack, Google Groups or Twitter. If you’re interested in the feature design details, we have also published new design documents on GitHub. Check them out!

We must now thank all of the community contributions. You can find the list of them in the release notes. Every engagement is highly appreciated, whether it’s a pull request to the production code, reporting issues, spotting typos in the documentation or just getting back to us with feedback.

Happy Hazelcasting!

Writing Multiple Tables to 1 (or Multiple) Sheets in Excel with Alteryx

$
0
0

Feed: The Information Lab.
Author: samuel.shurmer.

Writing Multiple Tables to 1 (or Multiple) Sheets in Excel with Alteryx

Often when using Alteryx, or in any form of reporting, we can find ourselves wanting to output different data sections or different findings into multiple places. Now anyone who is experienced with Alteryx may know that you can use the default output tool to output identical sheets, by using the “Take File/Table Name From Field” and “Changing the File/Table Name”.

However, this has its limitations, only allowing us to output the same sheet, but grouping it by a different field. So in this example, it is outputting all the sales for our store across Europe, but splitting each page by country so they can go to the relevant regional managers. However, what if we wanted to send multiple different reports?

So imagine you are that regional manager and you want it broken down into the overall sales, like you are receiving above, an aggregation by client (Customer), and also a breakdown by product category. Using the above method would work, but you would now receive 3 separate files instead, and would hence require 3 output tools.

To do the output via 1 tool we will need to bring in and use 3 tools from the reporting tool set:

  • Table – this will allow Alteryx to turn the data into a table object (This should only be carried out after any data preparation has occurred as it will now be treated by Alteryx in the same vein any reporting object would be (only viewable via a browse tool))
  • Layout tool – this lets Alteryx move and reorder the configuration of multiple tables (which is exactly what we have)
  • Render tool – this allows Alteryx to output the objects in many different forms, either temporarily or permanently.

The workflow we will end up with will contain 12 tools, within 8 different parts, looking like this:

Our Final Workflow

After inputting our data, we will need to split this off into the 3 streams we spoke about earlier:

  • By Customer
  • By Category
  • Overall

All being split by country, the summarize tools being setup like below:

Note we need to bring through the country here as well as the relevant aggregation, otherwise we will lose that level of detail for later on

After creating both of these we are going to bring our first reporting tool onto the canvas, and this is to bring a Basic Table tool into all 3 data streams we are going to create/have created.

These should be set up as the following:

Feel free to change how the width is configured, as this will not affect the outcome, but we do need to keep the group by Country/Region ticked as this will give us multiple tables, one for each country, otherwise this will all be configured into one. The bottom section allows us to reorder our columns, rename fields, and remove fields (in many ways it is similar to a select tool).

Our workflow should now look like the following:

Now to move forward we will need to rename Table in the bottom stream (the stream with no aggregations) to Layout, this is so that later we can union with no issues.

After this, we will need to union the top 2 tables to create 30 separate tables, as the data I’ve used here is for 15 distinct European countries, and there is now 2 of each country; 1 containing the customer information, and the other the category. By unioning the 2 sides here we are moving them into the same data stream, this will allow us to bring in another reporting tool; the Layout tool.

The Layout tool here will be configured in the following way:

A couple of items to note here –

  • Firstly, we have selected the layout mode as Each Group of Records, this is to keep it as a horizontal line for each country, if Each Individual Record was selected Alteryx would bring through all the records, So 1 of each for Customer and Category, and hence place nothing side by side. Using All Records Combined would bring all 30 records together side by side, which is not what we want here.
  • Secondly, make sure Group By is selected for Country/Region, otherwise, it won’t be grouping by anything, and you will create the same result as Each Individual Record.
  • Lastly, as previously the rest of the options are only aesthetic options, so these won’t change our output going forward, but just how it looks; feel free to edit these to your own desires.

After updating this we are going to Union the third stream so that we now only have one stream of data. So bringing the 2 side by side tables together with the all information table that we were using earlier. This will be carried out through an Auto Config by Name; please note here that the bottom table will require a select tool (Explained earlier) to change the name from Table to Layout, otherwise they will not line up in the same columns using Auto Config by name.

Nearing the end of the workflow we now have the following:

There are two small steps that we now need to take to get Alteryx to output multiple tables into one Excel sheet. To start this we are going to reintroduce another Layout tool, though this time it will be set up in a vertical layout; this is as we want our tables (in this case objects as the 2 tables that have been aggregated are now 1 object) on top of each other. The key to what we are doing here, however, is it will be Vertical with section breaks, not just normal vertical orientation. This creates the following “Breaks” in our layout:

  • For .xls and .xlsx, a section break is equivalent to a new sheet within a workbook.
  • For .pdf, .doc, .docx, and .rft, a section break is equivalent to a new page.
  • For .html and .pcxml, a section break is not created.

As we are using a .xlsx this will create a separate page for each object, leaving us with 30 pages (sheet 1 is our 2 aggregated tables for Austria, sheet 2 is our individual table for Austria etc.) if selected on Each Individual Record. If we instead select group by country/region this will make each country/region its own, storing all 3 of our tables together. Finally, we should make sure that the section name is the same as our grouping, as this defines the sheet names; otherwise, they will just be sheet 1, sheet 2 etc.

Note: as previously the rest of the options are only aesthetic options, so these won’t change our output going forward, but just how it looks, feel free to edit these to your own desires.

The last tool for us to worry about is our Render tool, essentially acting as our output. This will output all of the objects created so far (we now only have 15 objects, all containing 3 tables each), there isn’t too much to do within this tool other than set up what we are outputting. The reason we are using the render tool, and not the output tool, is that the output tool is unable to process the objects; these objects are in a specific kind of image related coding which requires rendering, not just an output.

We first need to select our output mode. The Render tool will allow us to create temporary objects (these are useful for analytical apps), however in our case, we want to create a permanent file, so we should select a Specific Output File. Under here we need to choose a path for our file, saving it to a specific location. This is where we also select our file type, we want to make sure ours is .xlsx. The final important item that we need to change is the Data Field which we need to define as our data, contained within our Layout field, the separator here makes little difference as our records are already being split by section, so if we hadn’t carried out this action earlier we could have defined it here.

Note: as previously the rest of the options are only aesthetic options, so these won’t change our output going forward, but just how it looks, feel free to edit these to your own desires.

Our Workflow should now look the same as the finished workflow presented at the start:

And just like that, you are able to output multiple tables into multiple sheets within an excel workbook. This technique will also work for PDF’s, putting each set of charts on a page, however a little more care needs to go into the aesthetics of PDF’s than Excel workbooks. If you want to change the look and feel of the tables we’ve created here you may want to use Ben Moss’s technique to bring in VBA Macros to you’re Alteryx workflow here.

Thanks for reading, and If you’d like to reach out for any questions feel free to reach out in the comments below.

Enhanced monitoring and automatic scaling for Apache Flink

$
0
0

Feed: AWS Big Data Blog.

Thousands of developers use Apache Flink to build streaming applications to transform and analyze data in real time. Apache Flink is an open-source framework and engine for processing data streams. It’s highly available and scalable, delivering high throughput and low latency for the most demanding stream-processing applications. Monitoring and scaling your applications is critical to keep your applications running successfully in a production environment.

Amazon Kinesis Data Analytics reduces the complexity of building and managing Apache Flink applications. Amazon Kinesis Data Analytics manages the underlying Apache Flink components that provide durable application state, metrics and logs, and more. Kinesis Data Analytics recently announced new Amazon CloudWatch metrics and the ability to create custom metrics to provide greater visibility into your application.

In this post, we show you how to easily monitor and automatically scale your Apache Flink applications with Amazon Kinesis Data Analytics. We walk through three examples. First, we create a custom metric in the Kinesis Data Analytics for Apache Flink application code. Second, we use application metrics to automatically scale the application. Finally, we share a CloudWatch dashboard for monitoring your application and recommend metrics that you can alarm on.

Custom metrics

Kinesis Data Analytics uses Apache Flink’s metrics system to send custom metrics to CloudWatch from your applications. For more information, see Using Custom Metrics with Amazon Kinesis Data Analytics for Apache Flink.

We use a basic word count program to illustrate the use of custom metrics. The following code shows how to extend RichFlatMapFunction to track the number of words it sees. This word count is then surfaced via the Flink metrics API.

private static final class Tokenizer extends RichFlatMapFunction<String, Tuple2<String, Integer>> {
     
            private transient Counter counter;
     
            @Override
            public void open(Configuration config) {
                this.counter = getRuntimeContext().getMetricGroup()
                        .addGroup("kinesisanalytics")
                        .addGroup("Service", "WordCountApplication")
                        .addGroup("Tokenizer")
                        .counter("TotalWords");
            }
     
            @Override
            public void flatMap(String value, Collector<Tuple2<String, Integer>>out) {
                // normalize and split the line
                String[] tokens = value.toLowerCase().split("\W+");
     
                // emit the pairs
                for (String token : tokens) {
                    if (token.length() > 0) {
                        counter.inc();
                        out.collect(new Tuple2<>(token, 1));
                    }
                }
            }
        }

Custom metrics emitted through the Flink metrics API are forwarded to CloudWatch metrics by Kinesis Data Analytics for Apache Flink. The following screenshot shows the word count metric in CloudWatch.

Custom automatic scaling

This section describes how to implement an automatic scaling solution for Kinesis Data Analytics for Apache Flink based on CloudWatch metrics. You can configure Kinesis Data Analytics for Apache Flink to perform CPU-based automatic scaling. However, you can automatically scale your application based on something other than CPU utilization. To perform custom automatic scaling, use Application Auto Scaling with the appropriate metric.

For applications that read from a Kinesis stream source, you can use the metric millisBehindLatest. This captures how far behind your application is from the head of the stream.

A target tracking policy is one of two scaling policy types offered by Application Auto Scaling. You can specify a threshold value around which to vary the degree of parallelism of your Kinesis Data Analytics application. The following sample code on GitHub configures Application Auto Scaling when millisBehindLatest for the consuming application exceeds 1 minute. This increases the parallelism, which increases the number of KPUs.

The following diagram shows how Application Auto Scaling, used with Amazon API Gateway and AWS Lambda, scales a Kinesis Data Analytics application in response to a CloudWatch alarm.

The sample code includes examples for automatic scaling based on the target tracking policy and step scaling policy.

Automatic scaling solution components

The following is a list of key components used in the automatic scaling solution. You can find these components in the AWS CloudFormation template in the GitHub repo accompanying this post.

  • Application Auto Scaling scalable target – A scalable target is a resource that Application Auto Scaling can scale in and out. It’s uniquely identified by the combination of resource ID, scalable dimension, and namespace. For more information, see RegisterScalableTarget.
  • Scaling policy – The scaling policy defines how your scalable target should scale. As described in the PutScalingPolicy, Application Auto Scaling supports two policy types: TargetTrackingScaling and StepScaling. In addition, you can configure a scheduled scaling action using Application Auto Scaling. If you specify TargetTrackingScaling, Application Auto Scaling also creates corresponding CloudWatch alarms for you.
  • API Gateway – Because the scalable target is a custom resource, we have to specify an API endpoint. Application Auto Scaling invokes this to perform scaling and get information about the current state of our scalable resource. We use an API Gateway and Lambda function to implement this endpoint.
  • Lambda – API Gateway invokes the Lambda function. This is called by Application Auto Scaling to perform the scaling actions. It also fetches information such as current scale value and returns information requested by Application Auto Scaling.

Additionally, you should be aware of the following:

  • When scaling out or in, this sample only updates the overall parallelism. It doesn’t adjust parallelism or KPU.
  • When scaling occurs, the Kinesis Data Analytics application experiences downtime.
  • The throughput of a Flink application depends on many factors, such as complexity of processing and destination throughput. The step-scaling example assumes a relationship between incoming record throughput and scaling. The millisBehindLatest metric used for target tracking automatic scaling works the same way.
  • We recommend using the default scaling policy provided by Kinesis Data Analytics for CPU-based scaling, the target tracking auto scaling policy for the millisBehindLatest metric, and a step scaling auto scaling policy for a metric such as numRecordsInPerSecond. However, you can use any automatic scaling policy for the metric you choose.

CloudWatch operational dashboard

Customers often ask us about best practices and the operational aspects of Kinesis Data Analytics for Apache Flink. We created a CloudWatch dashboard that captures the key metrics to monitor. We categorize the most common metrics in this dashboard with the recommended statistics for each metric.

This GitHub repo contains a CloudFormation template to deploy the dashboard for any Kinesis Data Analytics for Apache Flink application. You can also deploy a demo application with the dashboard. The dashboard includes the following:

  • Application health metrics:
    • Use uptime to see how long the job has been running without interruption and downtime to determine if a job failed to run. Non-zero downtime can indicate issues with your application.
    • Higher-than-normal job restarts can indicate an unhealthy application.
    • Checkpoint information size, duration, and number of failed checkpoints can help you understand application health and progress. Increasing checkpoint duration values can signify application health problems like backpressure and the inability to keep up with input data. Increasing checkpoint size over time can point to an infinitely growing state that can lead to out-of-memory errors.
  • Resource utilization metrics:
    • You can check the CPU and heap memory utilization along with the thread count. You can also check the garbage collection time taken across all Flink task managers.
  • Flink application progress metrics:
    • numRecordsInPerSecond and numRecordsOutPerSecond show the number of records accepted and emitted per second.
    • numLateRecordsDropped shows the number of records this operator or task has dropped due to arriving late.
    • Input and output watermarks are valid only when using event time semantics. You can use the difference between these two values to calculate event time latency.
  • Source metrics:
    • The Kinesis Data Streams-specific metric millisBehindLatest shows that the consumer is behind the head of the stream, indicating how far behind current time the consumer is. We used this metric to demonstrate Application Auto Scaling earlier in this post.
    • The Kafka-specific metric recordsLagMax shows the maximum lag in terms of number of records for any partition in this window.

The dashboard contains useful metrics to gauge the operational health of a Flink application. You can modify the threshold, configure additional alarms, and add other system or custom metrics to customize the dashboard for your use. The following screenshot shows a section of the dashboard.

Summary

In this post, we covered how to use the enhanced monitoring features for Kinesis Data Analytics for Apache Flink applications. We created custom metrics for an Apache Flink application within application code and emitted it to CloudWatch. We also used Application Auto Scaling to scale an application. Finally, we shared a CloudWatch dashboard to monitor the operational health of Kinesis Data Analytics for Apache Flink applications. For more information about using Kinesis Data Analytics, see Getting Started with Amazon Kinesis Data Analytics.


About the Authors

Karthi Thyagarajan is a Principal Solutions Architect on the Amazon Kinesis team.

Deepthi Mohan is a Sr. TPM on the Amazon Kinesis Data Analytics team.

Combating Money Laundering: Graph Data Visualizations

$
0
0

Feed: Neo4j Graph Database Platform.
Author: David Penick.
Money laundering is among the hardest activities to detect in the world of financial crime. Funds move in plain sight through standard financial instruments, transactions, intermediaries, legal entities and institutions – avoiding detection by banks and law enforcement. The costs in regulatory fines and damaged reputation for financial institutions are all too real. Neo4j provides an advanced, extensible foundation for fighting money laundering, reducing compliance costs and protecting brand value.

In this final blog in our series, we look at how graph data visualizations help uncover money laundering and dig into Neo4j performance under heavy AML workloads with tens of millions of transactions per day.

Graph Data Visualizations

Neo4j allows for money queries to be viewed in various ways. Output can feed downstream applications or be displayed directly to users:

  • Executives often want interactive dashboards with graphic visualizations and green,
    yellow and red scoring of key performance indicators
  • Analysts prefer to explore context behind dashboard results without writing code and using IT-developed queries in playbooks
  • Data Scientists & Power Users may write their own ad hoc queries or graph algorithms or to use the results of graph algorithms to segment data and identify central entities
Feature Image Scalability

Dashboards and APIs

Tableau Dashboard

Neo4j has a Business Intelligence (BI) Connector that connects to Neo4j Graph Database from business intelligence tools such as Tableau.

React Dashboard

Developers build dashboards using the GRANDstack (GraphQL, React, Apollo, Neo4j Database). The React dashboard pictured below is built atop the GraphQL API.

Graph Visualizations

Shared Attributes

Shared attributes can indicate that entities are the same. These kinds of patterns are useful in both ER and flagging processes. The Neo4j Bloom visualizations below show account holders who share attributes – such as a tax number, address and phone number – with other account holders. The intensity of the shade of red increases as suspiciousness increases.

Circular Payments: Placement, Layering, Integration

One common money laundering technique is to use circular payments to exchange dirty money for laundered assets. The Bloom graph visualizations below depict circular payments. This is a mono-partite graph of scored account holders. Red nodes are high-risk, tan nodes are medium-risk and yellow nodes are low-risk.

Payment Chains

Once an entity reaches a threshold of risk that strongly indicates suspicious behavior, a subsequent set of templated queries look for high-risk entities associated with a party.

A common money laundering behavior is to transfer funds to cohort entities for pass-through transactions. These transactions are often layered several levels deep. A templated query result worth exploring could lead to discovery of a payment chain.

The Neo4j Bloom graph visualization below depicts a payment chain starting from a suspicious entity on the upper left. The ER scores for individuals, corporations or financial institutions who might be the same (based on ER process scores) are depicted in dark blue clusters. The process flagged multiple accounts in dark green for investigation of connections to the original, suspicious cluster that appears at the upper left.

Data Sources & Input API

A Neo4j anti-money laundering solution ingests data from multiple sources.

The ingestion pipeline is model-driven, automated and flexible enough to stay ahead of the fast-changing techniques used by money launderers. The Neo4j AML Framework processes billions of transactions per day in near real time and can be extended to address all GRC functions beyond AML.

Hop provides a flexible API to handle constantly-changing data sources and money queries. It has plugins to read SWIFT, ACH, wire transfers and other transaction formats, and it can also utilize Java libraries for that purpose.

Hop’s automated, model-driven approach makes it ideal for automating ingestion pipelines, processing more than a million rows per second. It consolidates from multiple data sources, parses and extracts entities, validates, enriches and normalizes data. Hop also connects to native sources directly and maps data formats to the Neo4j graph data model API.

Solution Framework Performance Testing

Neo4j is performant, trusted, available, secure, agile and extensible, and it scales linearly to hundreds of billions of ingested records while still returning complex pattern-match results in milliseconds. The Neo4j AML Framework easily meets service level agreements for tens of
millions of inserts per day.

The Neo4j AML Framework is an extensible framework with customizable plug-and-play components. AML staff can customize and extend the base framework with:

  • Money queries
  • Custom graph data models
  • Internal and third-party data sources and streams
  • Ingestion APIs
  • Output APIs

The following configuration shows the best practice for stress testing and performance tuning to ensure that the Neo4j AML Framework meets the most stringent service level agreements.

The largest AML workloads process tens of millions of transactions and party inserts per day. Meanwhile dozens – or hundreds – of analysts and other GRC staff analyze entities and transactions. They typically require sub-200 millisecond query response time on 99% of all queries by dozens or hundreds of active concurrent users while simultaneously processing thousands of write transactions per second.

The Next Stage of the AML Battle

Winning the battle against money laundering requires a technology that better harvests information from transactions – and other sources – and better detects suspicious activity
in real time and at scale. This has been challenging because companies process billions of transactions per day involving tens of millions of parties.

The first step in improving detection is to harvest the information from transactions by connecting it to already-known information. The next step is applying algorithms that leverage relationships to pattern match and score relationships and behaviors that connect a network of people, places, corporations, financial institutions, merchants, transactions and events.

By leveraging Neo4j to connect data, compliance teams can:

  • Better comply with AML requirements and make more accurate predictions, thereby
    saving money on fines and detecting real money laundering more accurately
  • Reduce costs associated with fines and with investigating false positives and false
    negatives
  • Increase sales by improving brand-value reputation
  • Better comply with other global risk and compliance (GRC) requirements
  • Meet the most stringent AML requirements for performance, availability, security and
    agility at extreme scale

Neo4j unlocks the wealth of insights found by pattern matching on connected people, companies,
financial institutions, places and times in a financial network. Neo4j treats relationships like
first-class citizens, making it possible to match complex and changing patterns of connected
money laundering data in real time and at scale.

5 Data Privacy Tips for Remote Workers

$
0
0

Feed: Liquid Web.
Author: Adam Enfroy
;

Data privacy for remote workers is essential – it always has been – but now, more than ever, it is dominating the cybersecurity strategies of all businesses with a staggering 4.7 million people in the U.S. now working remotely.

But, with increasing levels of cybercrime and remote workers being targeted, it begs the question: How do we protect the privacy of remote workers and company data?

Last year, 4.1 billion data records were exposed due to data breaches, illustrating just how important it is for companies and remote workers to ensure that their data is kept safe and out of the hands of hackers.

So, with that in mind, let’s take a look at the five tips you should follow to ensure the privacy of your data.

1. Store Your Passwords in an Encrypted Vault

Every online account is protected by a password, but just how safe are they? The truth is that most of the passwords we use are not all secure. The reason why: entropy.

Entropy is the measurement of the randomness or diversity of a data-generating function.

Passwords with high entropy are completely random and have no meaningful patterns, making them almost impossible to crack.

Unfortunately, the average person can’t memorize complex random passwords, meaning human-generated ones tend to only be about 40 bits of entropy.

To put this into perspective, a password with 128 bits of entropy is virtually unbreakable; therefore, 40 bits give hackers a much higher possibility to predict the value.

With the average person having 70-80 passwords, the sheer volume that we have to remember makes us prone to unsafe password practices such as recycling old passwords or using the same ones for multiple accounts.

Hackers are well aware of these cyber hygiene pitfalls, and exploit them regularly for financial gain. No country or business is immune, and exposure to cybercrime is rife.

Poor password practices compound remote working risks, as employees often opt for convenience over security, saving sensitive login credentials using unsecured methods including spreadsheets, notes of paper, and sharing them over email.

The most effective way to protect credentials from malicious hackers is to store them in an encrypted password vault, otherwise known as a password manager.

Password managers for remote work security

Source

Password managers facilitate security and convenience by enabling businesses to add, edit, and store an unlimited number of passwords in a securely encrypted vault.

Therefore, your remote team no longer needs to remember long complex passwords. Instead, they can rely on the software to automatically fill the login credentials whenever they need them.

The zero-knowledge security models employed by password managers also lends itself to full data privacy where the software never sees or stores your unencrypted passwords on their servers.

If a hacker managed to hack the servers where your data is stored, they would only see streams of encrypted code that is meaningless and not of any value.

Ultimately, password managers enable remote workers to save unique passwords with high levels of entropy for each account in securely encrypted vaults to strengthen the security of business accounts.

They can also play a key role in ensuring complete data privacy is via single sign-on solutions that make business-critical accounts accessible in one convenient portal.

Remote workers simply need to login to the vault, click on the account they need access to, and they will be logged in automatically without ever seeing the login credentials.

2. Shield Your Data From Prying Eyes

Shield your data

Source

One of the main challenges that IT staff face with remote workers is the conundrum of providing them with a safe and secure way of accessing company resources while maintaining security and optimal network speeds.

This is where a VPN, or virtual private network, comes into play.

VPNs form the basic backbone of remote working security and provide workers with a secure method to connect to company resources, such as shared files. More than 400 million businesses and consumers are already making use of VPN connections, and this number continues to grow as more people start working from home.

Working remotely without using a VPN poses a serious security risk, since it makes it much easier for hackers to intercept confidential company data as it travels between your remote location and the office.

A VPN can be compared to a private tunnel that links your remote location directly with your office, and since the data that travels in this tunnel is shielded from view, it is much more difficult for hackers to intercept and steal sensitive data.

They can be used to connect to most remote resources, including mail servers, CRM programs and software, and even accounting systems.

It is especially important to use a VPN in cases where remote employees use their computers for both their personal and professional computing needs.

Employees can often unknowingly download emails or other files that have been infected with malware, and in doing so, expose confidential company data.

3. Secure All Your Devices, Not Just Work Ones

Endpoint security, in its simplest form, refers to the practice of securing the individual devices that connect to a network, such as laptops and mobile phones.

While securing you can enhance the protection of your cloud assets through security and compliance add-ons, endpoint security includes software such as antivirus, antimalware, and firewall programs, and it forms an essential part of any remote worker’s security arsenal.

However, it is important to remember that endpoint security does not just refer to the likes of antivirus software, but it also includes the way that we interact with our devices.

In order to reduce security vulnerabilities and the risk posed by hackers, remote workers should adopt safe computing practices, such as avoiding potentially malicious websites and not opening emails that may contain dodgy attachments.

Whilst working from home can often make us less vigilant to the threats that we face, it’s worth noting that endpoint devices are the second most targeted type of asset in data breaches, following servers.

Kaspersky threats

Source

Remote workers that choose to use their own devices for both work and personal use can create an avenue for hackers to worm their way into company systems if they are not properly protected.

It is therefore essential that remote workers notify IT teams of the devices they use to access business systems.

Because endpoint security solutions are often cloud-based, they can be easily distributed across devices remotely.

Alternatively, if you are not able to install the appropriate security software, it is best to only use the devices granted to you by your business, since these will have already been factored into your company’s IT security network and infrastructure.

The global endpoint security market is predicted to be worth $10.02 billion by the end of 2026, up from 5.30 billion USD in 2018.

This is an indicator of just how important it is for both corporations and end-users to invest in endpoint security if they have not already done so.

4. Use Encrypted Communication Platforms

Communication is key in every business, and it is even more important in remote working environments.

We often hear of hacked email accounts and the exposure of confidential business communications that have serious implications for data privacy.

But as businesses increasingly opt for chat-based and online meeting platforms, it becomes ever-more important to secure these newly adopted communication channels.

For this reason, consider using a secure and customizable CPaaS platform to secure your data and get your messages across.

Keeper chat cPaaS for remote work security

Source

Not only do chat applications facilitate higher levels of productivity, thanks to a more seamless communication method than email, but some also offer data privacy.

Secure chat applications, like Keeper Chat, encrypt messages before they are sent to the intended receiver. Should the message be intercepted by a hacker, they cannot be read, and your information stays private.

The benefit of these applications is that they are web-based and, therefore, offer cross-platform and device compatibility, making them ideal for remote working where they can be accessed anywhere, anytime.

5. Protect Yourself Beyond Software

Aside from using security software, there are a few other things that you can do to keep your data safe.

Kensington lock for remote work security

Source

Log Out Whenever You Leave Your Workspace

It is important to remember that public spaces are not as safe as the office spaces that we are accustomed to working in, and you should never leave your computer unlocked when it is not in your possession. An unlocked computer that is logged into secure company networks is a prime target for hackers, so make sure to log out before you leave.

Do Not Connect to Public Wi-Fi Hotspots

Public Wi-Fi often has little to no security, and you should avoid connecting your computer or smartphone to a public network whenever possible to protect yourself from malicious actors. A good alternative to a public hotspot may be bringing your own mobile data connection with you when you have to work outside of your usual workspace. Or, if you have no choice but to connect to a hotspot, use a VPN.

Physically Secure Your Devices

When you are working in a public space, you should consider using physical security devices such as a kensington lock to secure your laptop.

Ensure Your Business Documents Are Secure

With more businesses signing documents online and keeping important files in the cloud, you need to ensure their security. Use encrypted e-signature software and strong password protection for your business documents.

Adopt Remote Work Security Best Practices Today

Working remotely has become the new reality for many of us and it is somewhat unfamiliar territory.

By adopting these simple security practices, using the appropriate software to protect your data from prying eyes, and most importantly, maintaining good cyber hygiene, you will drastically improve your data privacy.

Struggling to Secure Your Entire Infrastructure? Download our Security Infrastructure Checklist.

eBook - SMB Security Checklist

Viewing all 965 articles
Browse latest View live